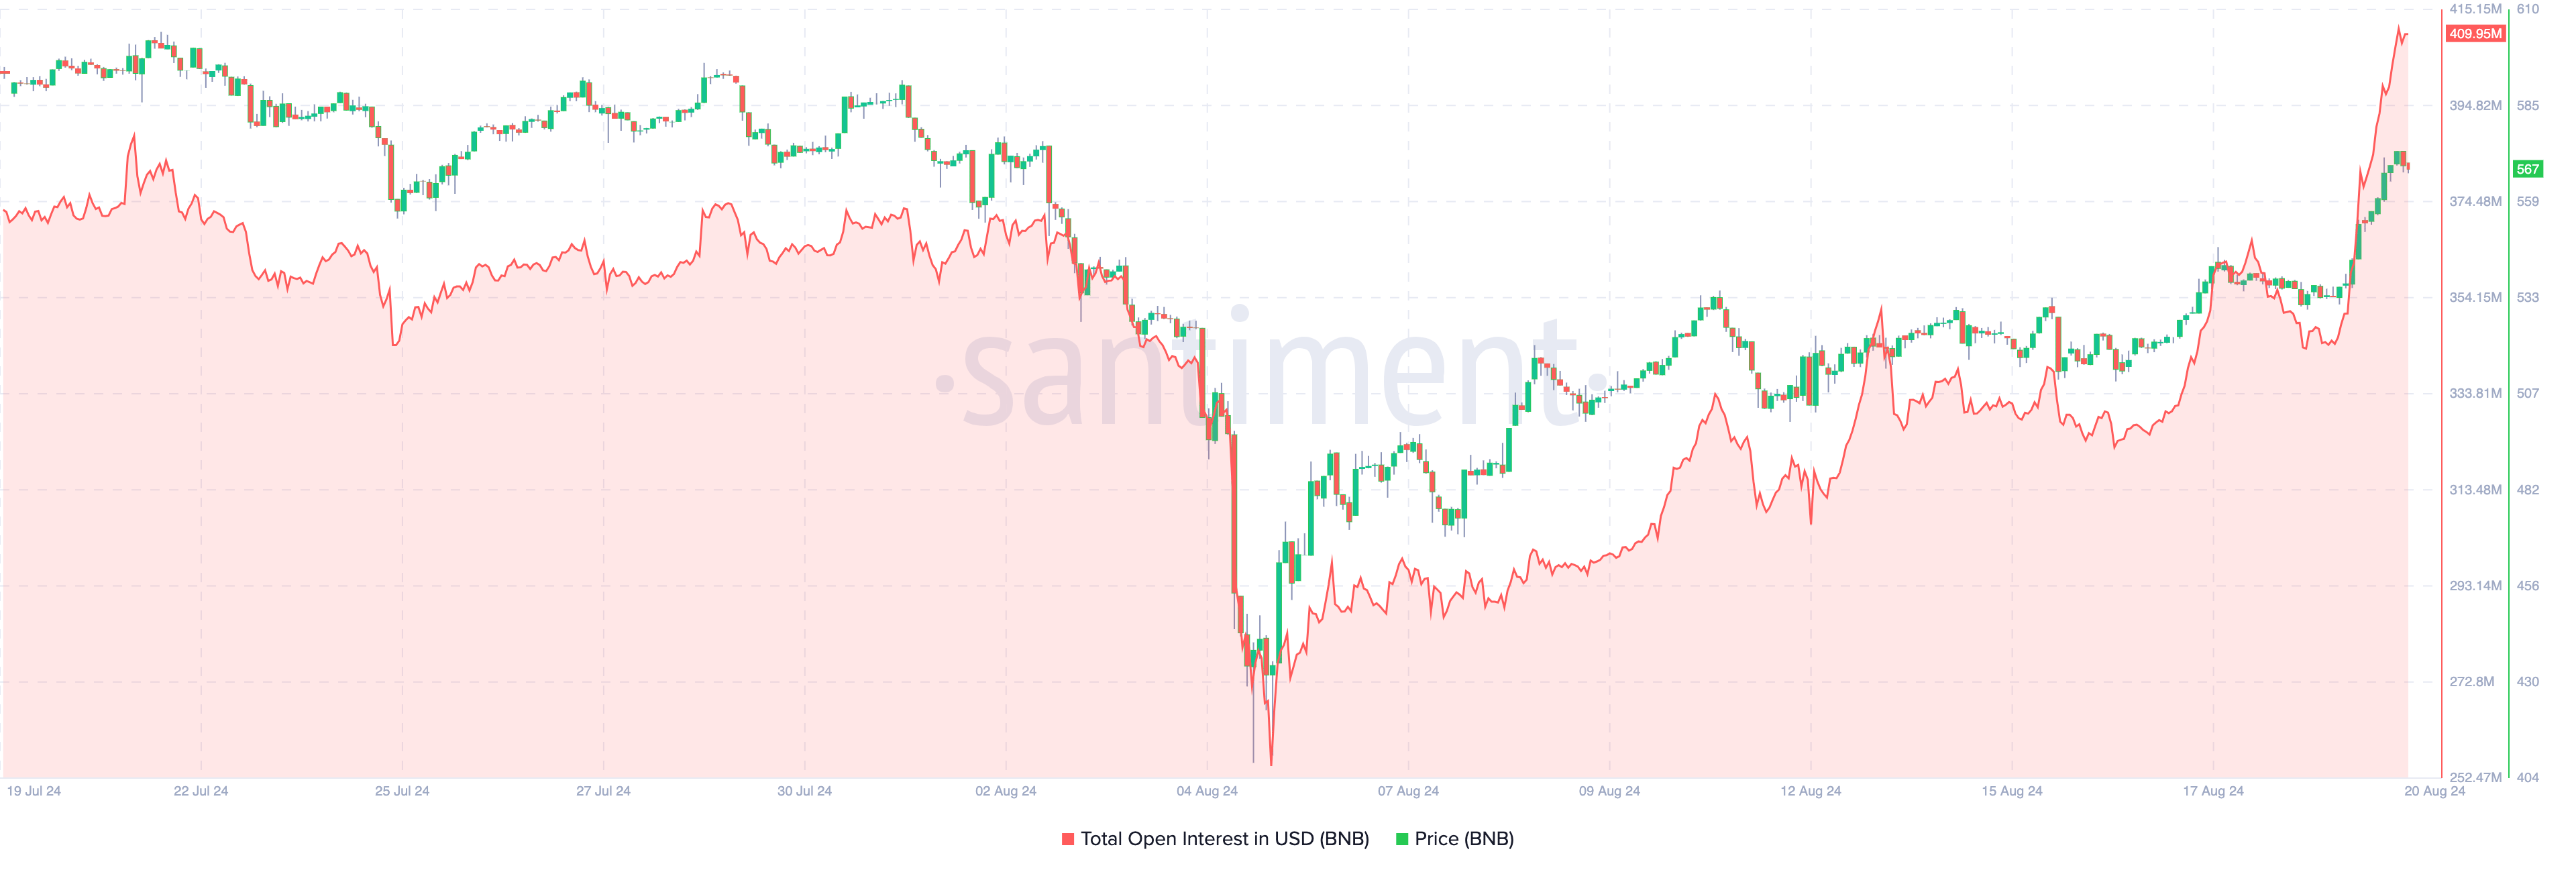
BNB emerged as one of the best-performing altcoins today. At the time of writing, the token is trading at $568.58, having increased by approximately 7% in the last 24 hours. However, BNB’s price is not the only aspect of the cryptocurrency seeing a rise. This on-chain analysis also examines other factors and what might happen next for the token.
What is Happening on the BNB Front?
An important data point rising along with the price is the Open Interest (OI) data. OI represents the value of outstanding contracts in the market. When it increases, it means investors are boosting their investments in a cryptocurrency, hoping to profit from price movements. However, a decrease in Open Interest indicates that investors are closing their current positions and withdrawing money from the futures market.
As of the date of this writing, BNB’s Open Interest was $408.10 million, the highest level since July 4th. This increase in data indicates a rise in speculative activities strongly correlated with the price increase.

Therefore, it would not be out of place to mention that the increase in OI played a role in helping BNB’s price rise to $567. As a result of the price increase, investors with open short positions faced liquidations worth $1.02 million in the last 24 hours.

BNB Chart Analysis
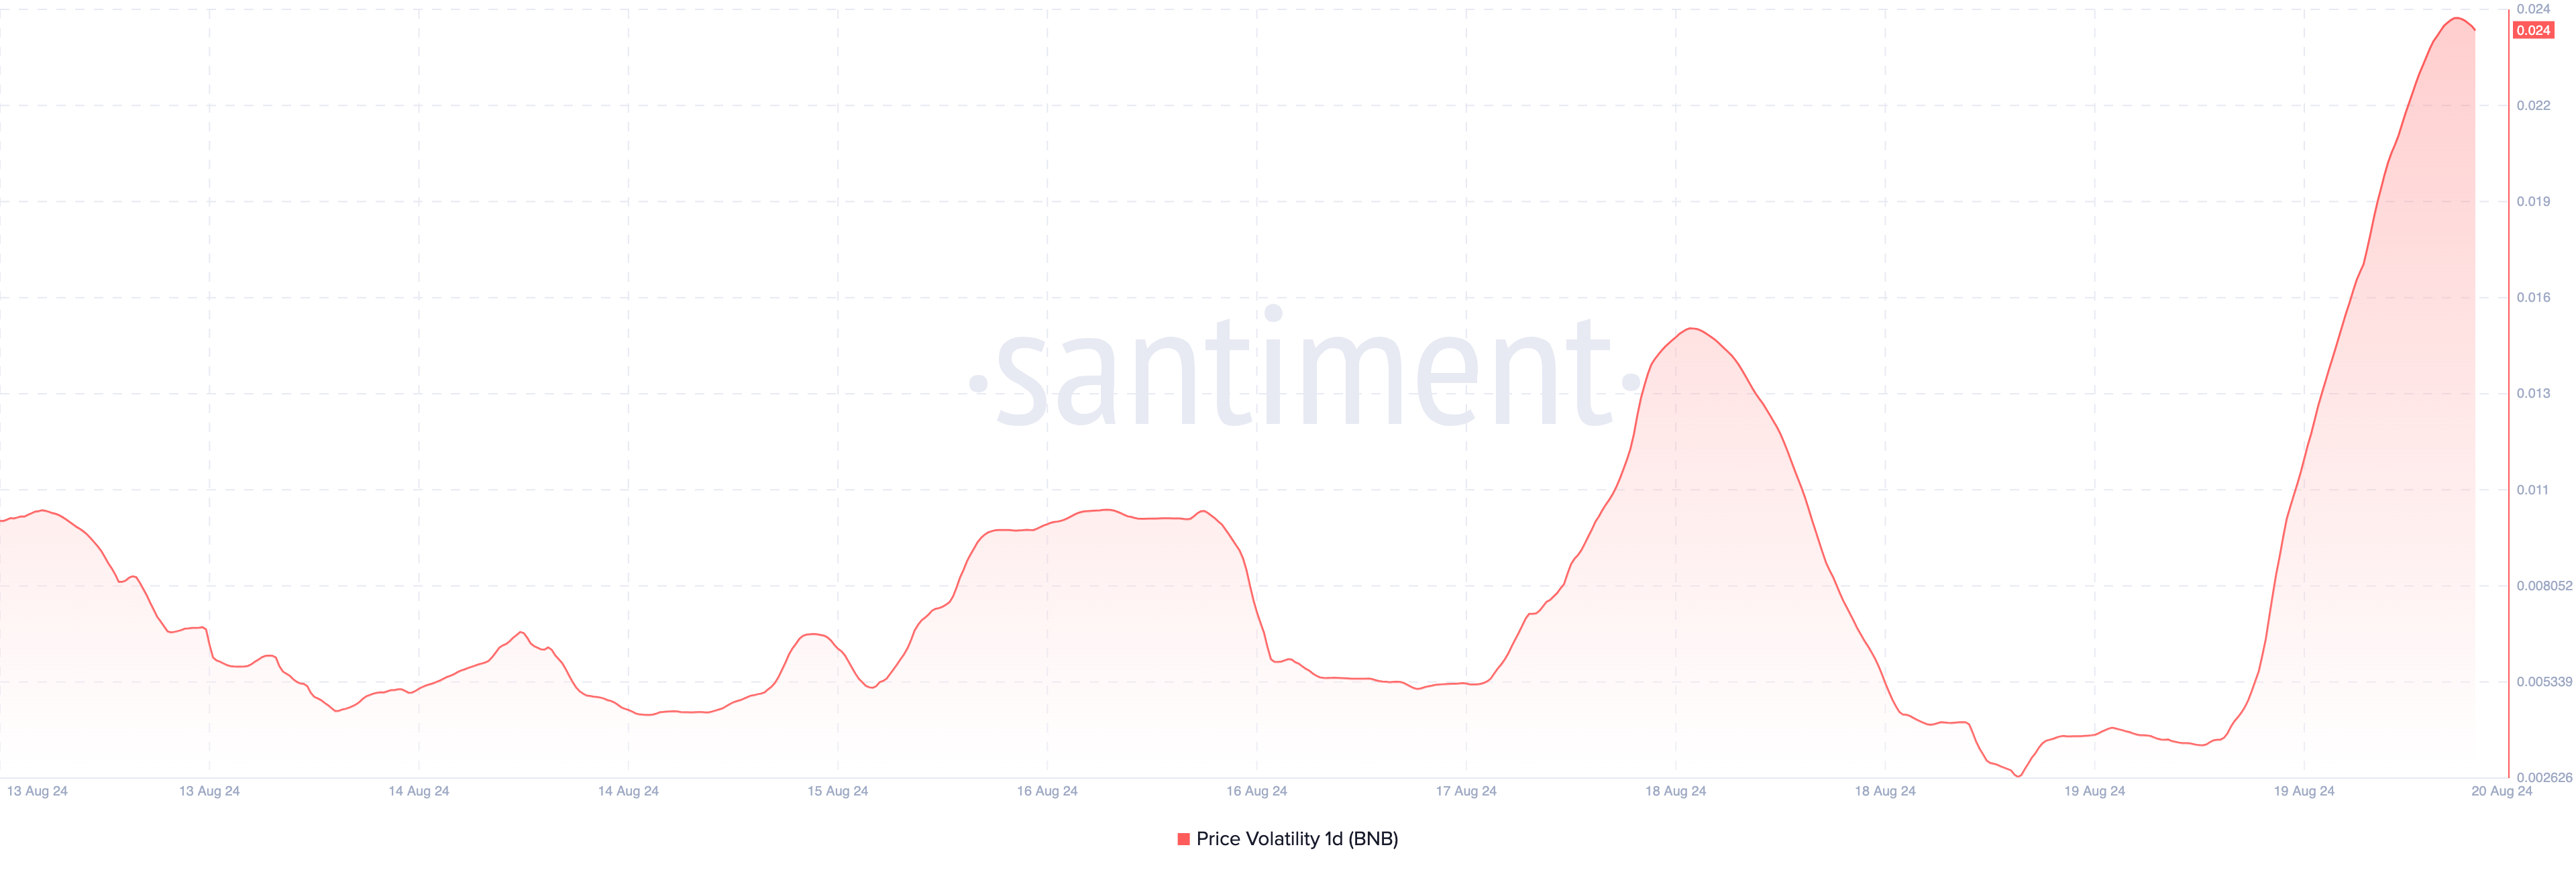
Looking once again at the on-chain data provided by Santiment, it is seen that BNB’s upward potential remains intact. This is due to the signals revealed by the one-day price volatility. Volatility in crypto shows how quickly prices can rise and fall. If selling pressure increases amid high volatility, an asset’s price can drop significantly in a short period.
BNB is experiencing an upward trend, so increasing volatility can strengthen the upward movement and potentially push the price to a higher value. If this continues, BNB’s price could retest $600. However, from a technical perspective, a bearish flag formation on the daily chart suggests caution.

A bearish flag appears when the slope of a trend line connects price peaks and troughs during consolidation. The flagpole in this pattern represents the decline dominated by bulls, allowing sellers to pull the price down. While the prevailing parallel channel indicates an upward trend, the bearish tendency suggests that bulls may not sustain the rise. If this happens, BNB’s price could drop to $525.80. However, increasing buying pressure could invalidate this thesis and potentially push the token price to $601.40.


