The hope for a potential bull market has taken a major hit, with almost all altcoin projects, including Cardano (ADA), reaching low prices not seen in a year following a broader market downturn. At the time of writing, ADA’s price was $0.30, a value it hadn’t reached since November 2023. How has this process affected token holders, and what might happen next?
What’s Happening on the Cardano Front?
The sharp drop in ADA’s value marks the most significant three-day selling wave since the 2022 bear market. While Cardano can recover, data from OMAP indicates the road is not yet clear. IOMAP classifies addresses based on profits, losses, and thresholds at various price ranges. The higher the number of addresses at a price level, the stronger the support or resistance it offers.
IntoTheBlock data shows that the total number of addresses in profit and purchased between $0.28 and $0.30 is not equal to those at a loss at $0.31. Specifically, 106,850 addresses hold a total of 572.21 million tokens at $0.31. In contrast, only 35,460 addresses are profitable, having purchased 451.95 million between $0.28 and $0.30.

Given the difference between addresses, Cardano may lose its hold at the $0.30 support due to pending sales. If this happens, the cryptocurrency may face another drop, potentially falling to $0.28. Beyond this, the Market Value to Realized Value (MVRV) Long/Short Difference was recorded at -10.79%. The MVRV difference indicates whether long-term holders are making more profit than short-term holders. A positive reading means long-term holders are more profitable. However, since it is negative for ADA, it implies the opposite.

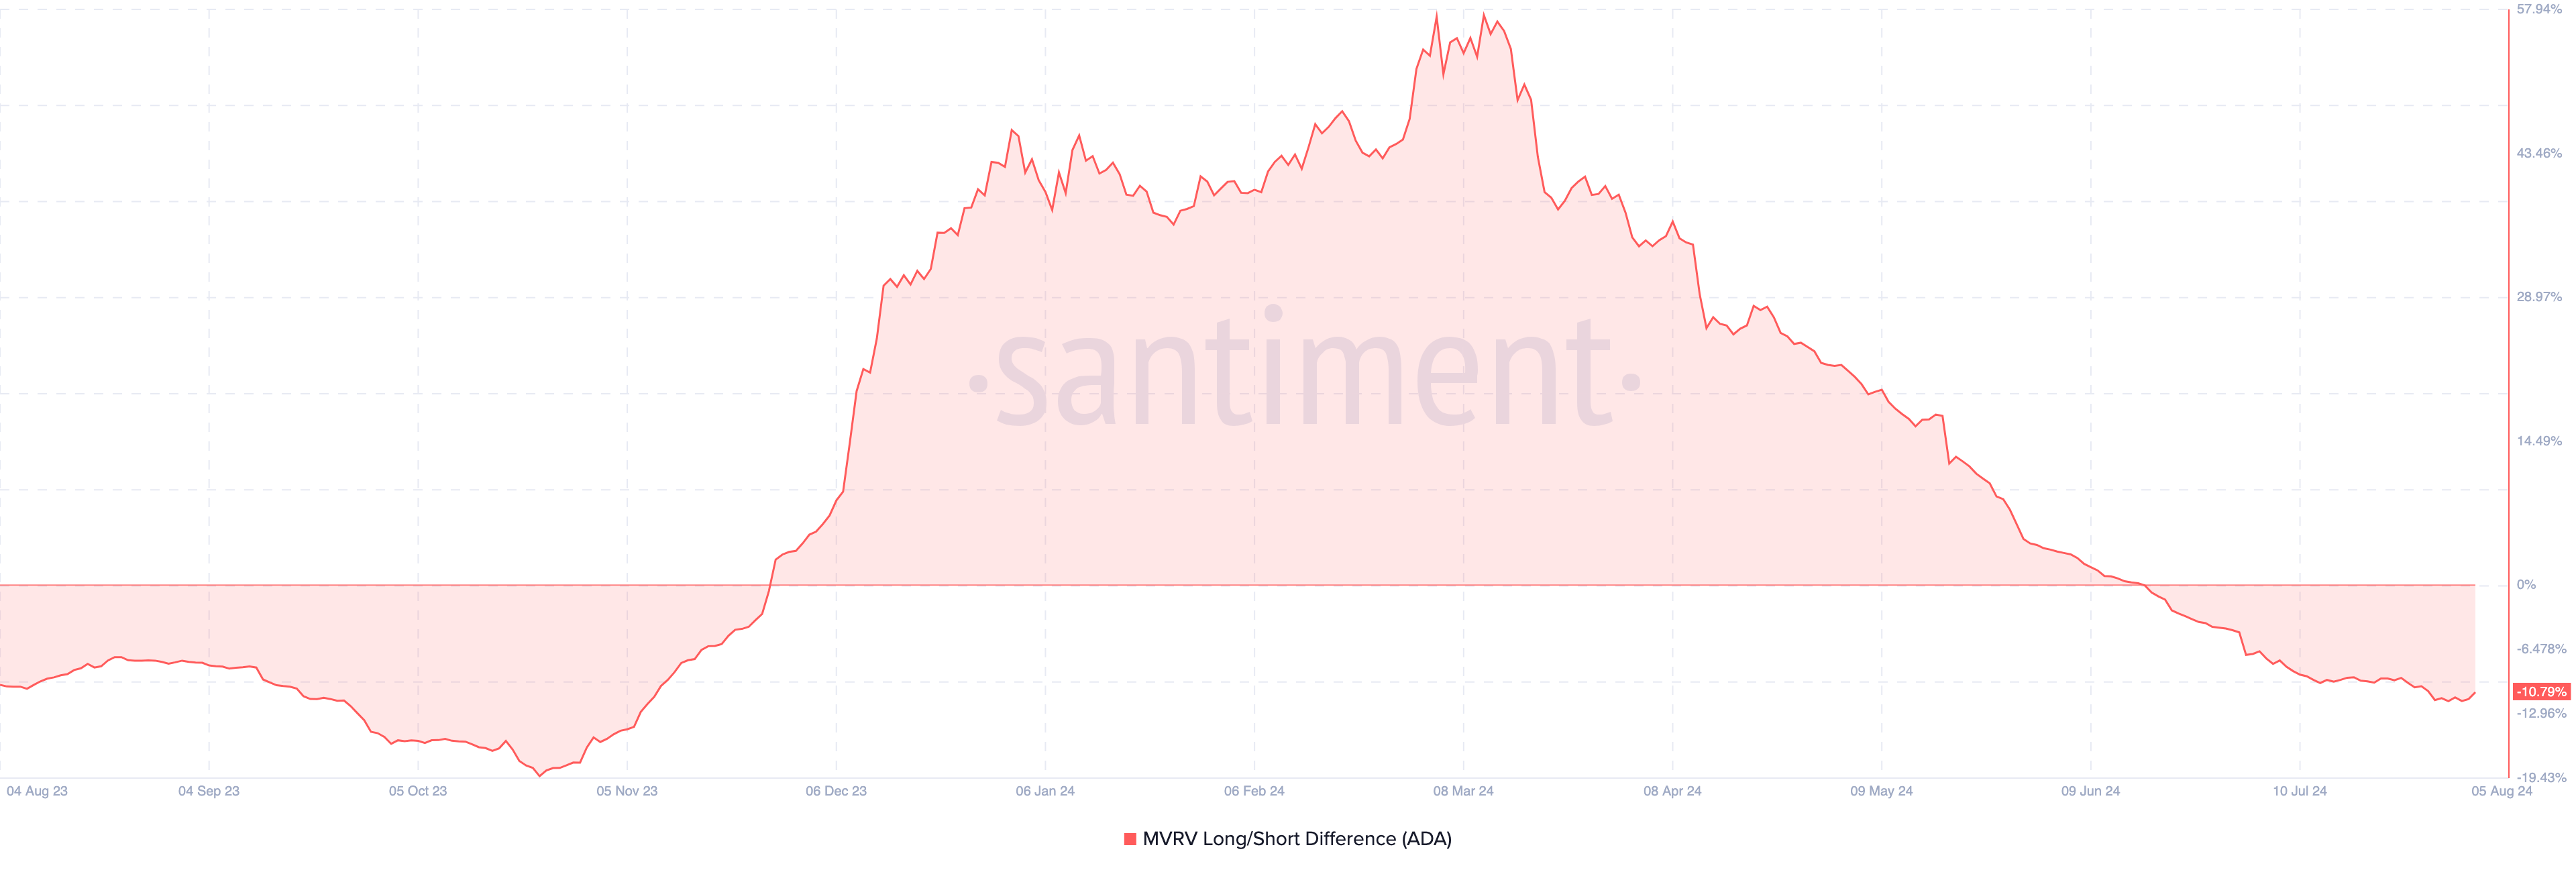
This decline may also indicate that the cryptocurrency is approaching a bear phase, as a -19.33% reading historically suggests that a token may no longer be in a bullish cycle. If ADA’s price falls again, selling pressure may resurface.
ADA Chart Analysis
Since August 2, multiple sell signals have appeared on Cardano’s daily chart, contributing to the token’s accelerated decline. For example, the Supertrend, which indicates price direction and generates buy and sell signals, was above ADA when the price was $0.42. Typically, if the red segment of the Supertrend is above the price, it can be a sell signal. The indicator gives a buy signal when the green area is below the price.
Therefore, it is not unreasonable to assume that Cardano showed signs of a collapse before today. The Parabolic Stop and Reverse (SAR) was in a similar situation. Like the Supertrend, it indicates direction and can determine an entry and exit point. Looking at the above chart, when the dotted lines are positioned above the price, it shows that the Parabolic SAR indicated a similar signal when ADA was trading at $0.42.

Moreover, the prevailing market structure indicates weakness and suggests that ADA may undergo another correction. The Fibonacci retracement, a technique that uses percentages to identify resistance and support points, reinforces this prediction. ADA’s price is below the 23.6% nominal retracement, indicating that bears fully control the price movement. If selling pressure increases, the cryptocurrency’s value could drop to the $0.27 level.