Chainlink (LINK) outperformed the rest of the cryptocurrency market last week with a 15% increase in its price. The two largest cryptocurrencies by market value, Bitcoin (BTC) and Ethereum (ETH), had less movement during the same period. The price increase may be due to the increase in new demand for the altcoin and the increase in the number of daily addresses completing transactions with LINK.
Latest Data from Glassnode!
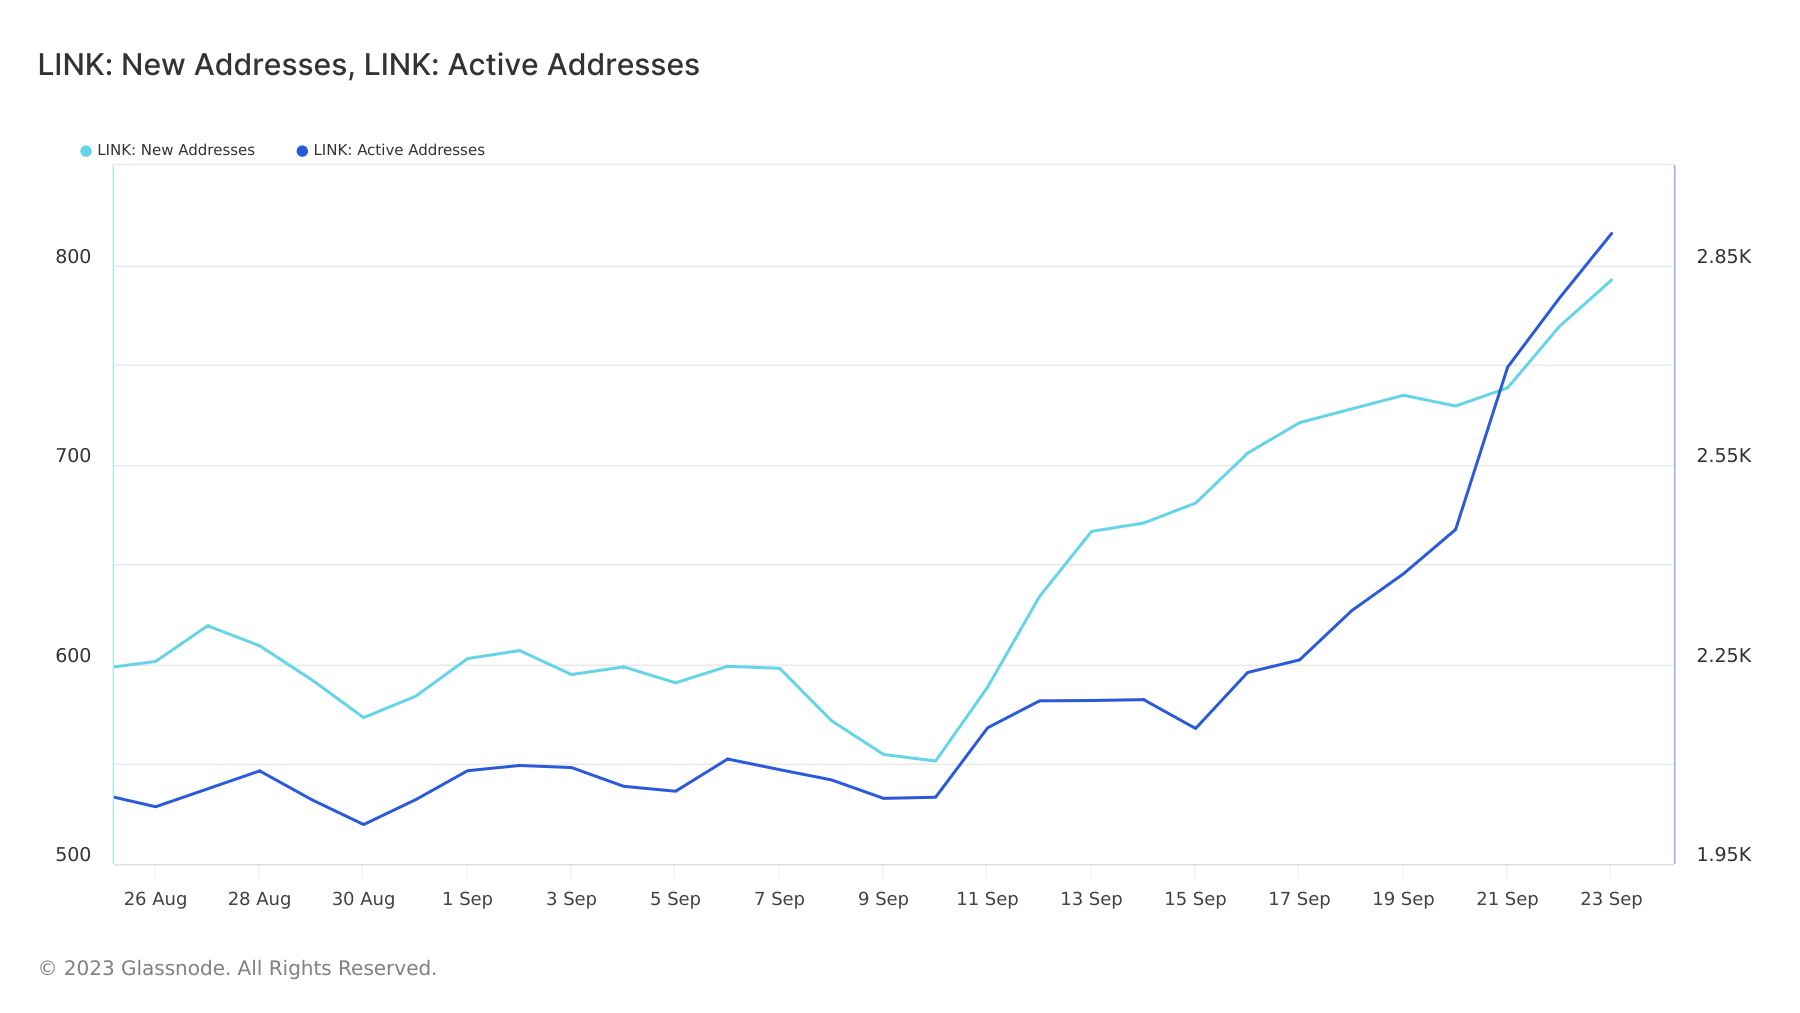
Data from on-chain data provider Glassnode shows that the daily number of new addresses and active addresses in LINK started to increase on September 10th and remained in an upward trend at the time of writing. As of September 23rd, 792 new addresses were created for LINK trading. This represented a 44% increase compared to the 551 new addresses created on September 10th. When looking at the daily number of unique addresses active as senders or receivers in the Chainlink network, a 41% increase was observed in the last two weeks.
Analysis of price movements on the daily chart of LINK confirmed the upward momentum in the altcoin market. Significant momentum indicators were above the center lines, indicating that spot investors continued to accumulate the token.
Additionally, LINK’s relative strength index (RSI) was 64.88. The money flow index (MFI) at 81.55 suggested that the token could be overbought due to increasing accumulation pressure. The Chaikin Money Flow (CMF), which tracks buying and selling pressure of a token over a specific period, was positioned above the zero line at a level of 0.23. CMF values above the zero line could indicate more buying pressure than selling pressure.

Transaction Activity in LINK!
There was also an upward trend in the LINK futures market. According to Coinglass data, the token’s open positions have increased by 69% since September 17th. Additionally, the funding rates on exchanges for the token were mostly positive during the same period. Despite some days with negative funding rates, most traders in the LINK futures market continued to invest in favor of price increase.
An evaluation of the exchange activity for the altcoin revealed a decrease in selling activity in the past few days. After a period of increased selling, there was a decrease in profit-taking activities in the past few days.
Data obtained from Glassnode showed that the Net Transfer Volume from Exchanges to Exchanges for LINK has been negative since September 22nd. This indicates that more LINK tokens have been transferred from exchanges rather than to exchanges since then.


