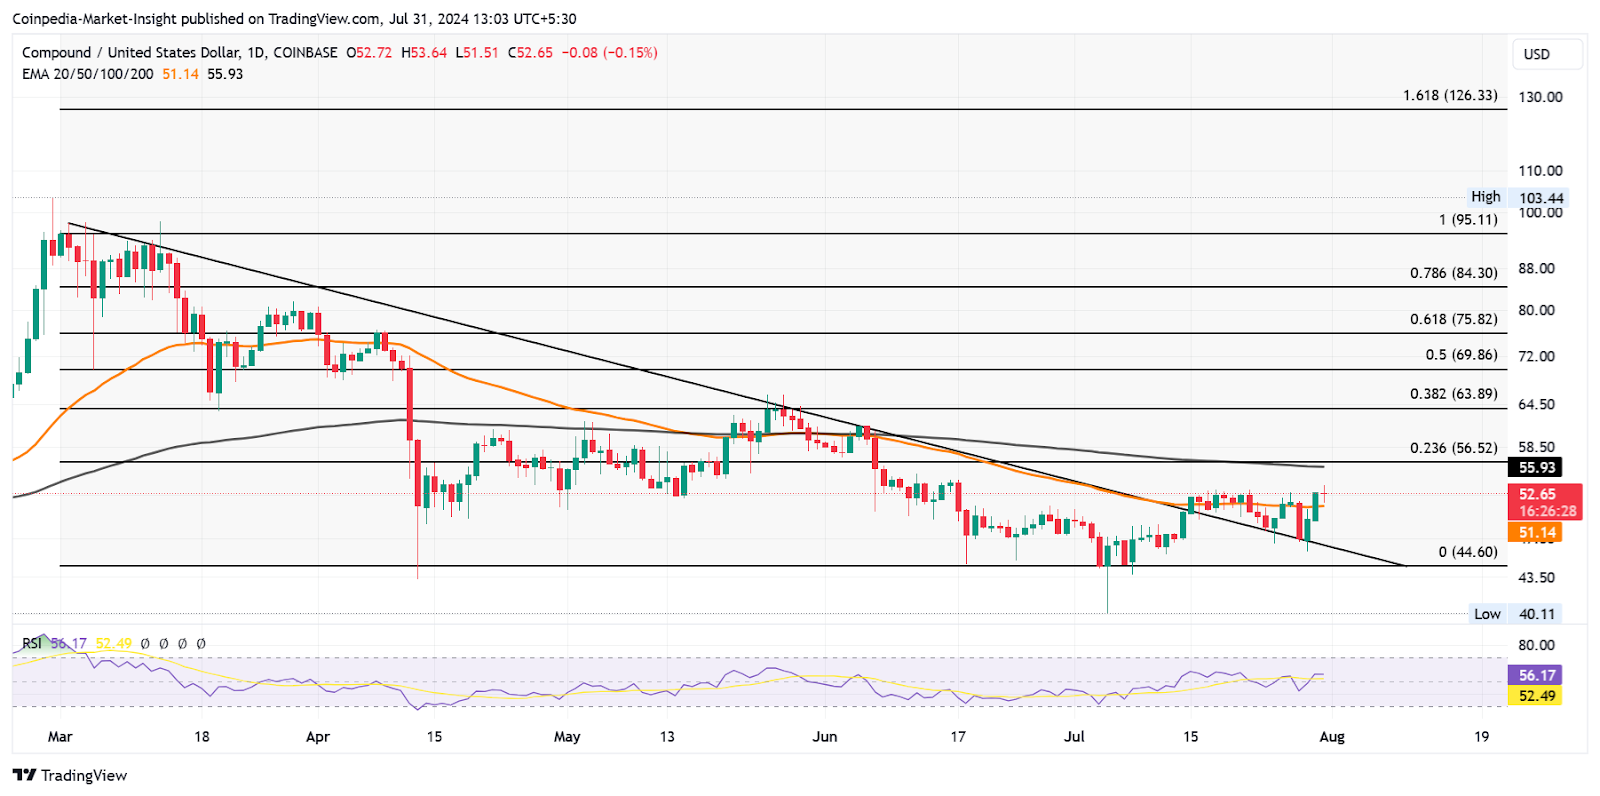
Compound (COMP) price has recently attracted attention with the increase in liquidations in the cryptocurrency market. Especially, two consecutive bullish candles seen on the daily chart are considered important signs for the upward momentum of the price.
COMP Price Surpasses 50-Day EMA
COMP price started to recover after bottoming out at $44 following a prolonged correction period. During this process, a downward trend line formed on the price chart, and the psychological support at $50 was broken. However, the recently strengthened bullish movement broke this trend line, making a notable breakout.

Especially, the price surpassing the 50-day Exponential Moving Average (EMA) level with an 11% increase and reclaiming the $50 level stands out as a critical indicator for the continuation of the rise.
Technical indicators provide clues that COMP’s price increase may continue. The Relative Strength Index (RSI) indicator on the daily timeframe is above the 50 level, indicating an upward movement in the price. Moreover, although the death cross between the 50-day and 200-day EMAs shows that the price is under downward pressure, the upward breakout of the 50-day EMA may signal the beginning of a new bullish trend. However, it is important to remember that the 200-day EMA still functions as a dynamic resistance.
Short-Term Expectations and Critical Levels for Altcoin
Although the short-term optimism in Compound’s COMP price seems to have peaked with two consecutive bullish candles, the overall trend is still neutral to downward. Despite the break of the trend line, the insufficient bullish momentum questions the upward potential. The Doji candle formed during the day indicates that the bullish movement may weaken.
Altcoin‘s price breaking above the 200-day EMA and the 23.60% Fibonacci level ($56.52) will be a significant development indicating a trend reversal. Breaking these levels could trigger an increase that may carry COMP’s price up to the $75 level.

 Türkçe
 Español


