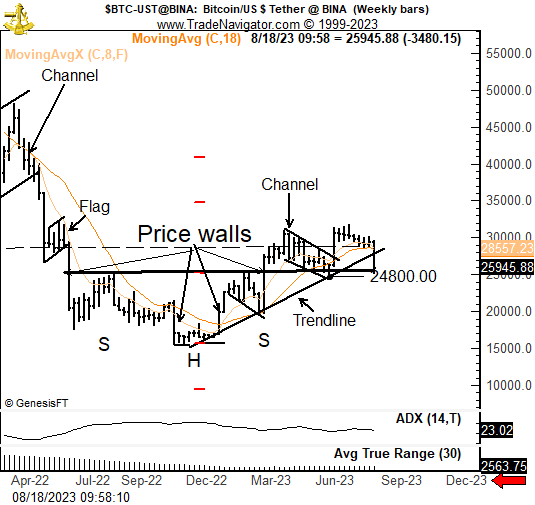
Peter Brandt, who has over 30 years of experience in the financial markets, summarized the possible scenarios for Bitcoin (BTC) in the short term. Although Brandt’s BTC price chart and his comments based on this chart are likely to please cryptocurrency investors, they also indicate the need for caution. Brandt’s analysis came when Bitcoin was experiencing a resurgence and was trading around $26,000 at the time of writing.
Critical Level for Bitcoin: $24,800
Brandt noted that, as Bitcoin continues to decline, the head and shoulders (H&S) pattern on the chart tested the neckline once again. The market expert believes that a daily and weekly candle close below the $24,800 level (the lowest level reached during the previous retest of BTC) would be detrimental to the price charts in the daily and weekly timeframes.

Brandt also added a note to the Bitcoin chart, mocking some of the cryptocurrency predictions made by people in the crypto world and belittling them, saying, “But hey, what do I know? I’m just a boomer who draws charts.” The H&S pattern is the opposite of the head and shoulders (H&S) pattern, which usually indicates a reversal of the downtrend to an uptrend in price charts.
Waiting for the Break of the Uptrend Line
Brandt expressed his expectation for Bitcoin to retest the well-established trendline that has come from the recent low point seen this year, and stated that the price movement of the crypto king throughout August could be the beginning of a bearish trend or a bear trap signal.
Furthermore, as a swing trader, the market expert mentioned that he is waiting for the break of the upward trendline and plans to short sell, saying, “If it turns out to be just a bear trap, I will consider it as a precursor to a rise. Essentially, I strongly prefer a horizontal chart structure.”


