Since October, the cryptocurrency market has seen a rise in momentum, with Bitcoin and many other crypto assets making investors happy. Layer-1 projects such as Solana and Avax frequently made headlines during this period, attracting investor attention with both price performance and ecosystem developments. But what can be expected for Solana and Avax, which have recently faced selling pressure? Let’s take a look.
Solana Chart Analysis
Solana price managed to rise above the moving averages on January 27 and is trying to stay above the downtrend line on January 28. The 20-day EMA level at $93 and the RSI just above the midpoint indicate a balance between buyers and sellers. If the price remains above the downtrend line, the SOL/USDT pair could attempt to rise to $107 and then to $117.
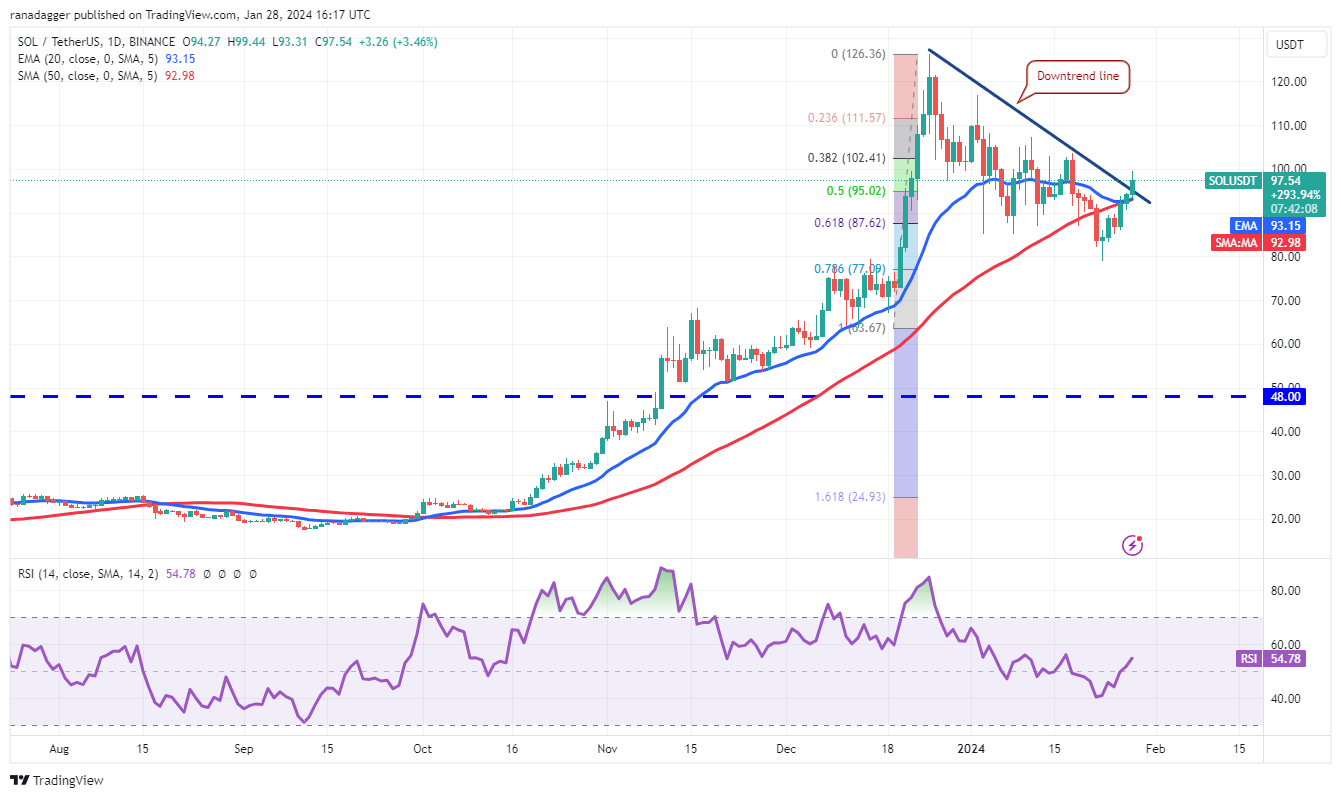
If bears want to prevent an upward move, they need to quickly push the price below the moving averages. This could trap aggressive bulls and open the doors for a retest of the $79 support level.
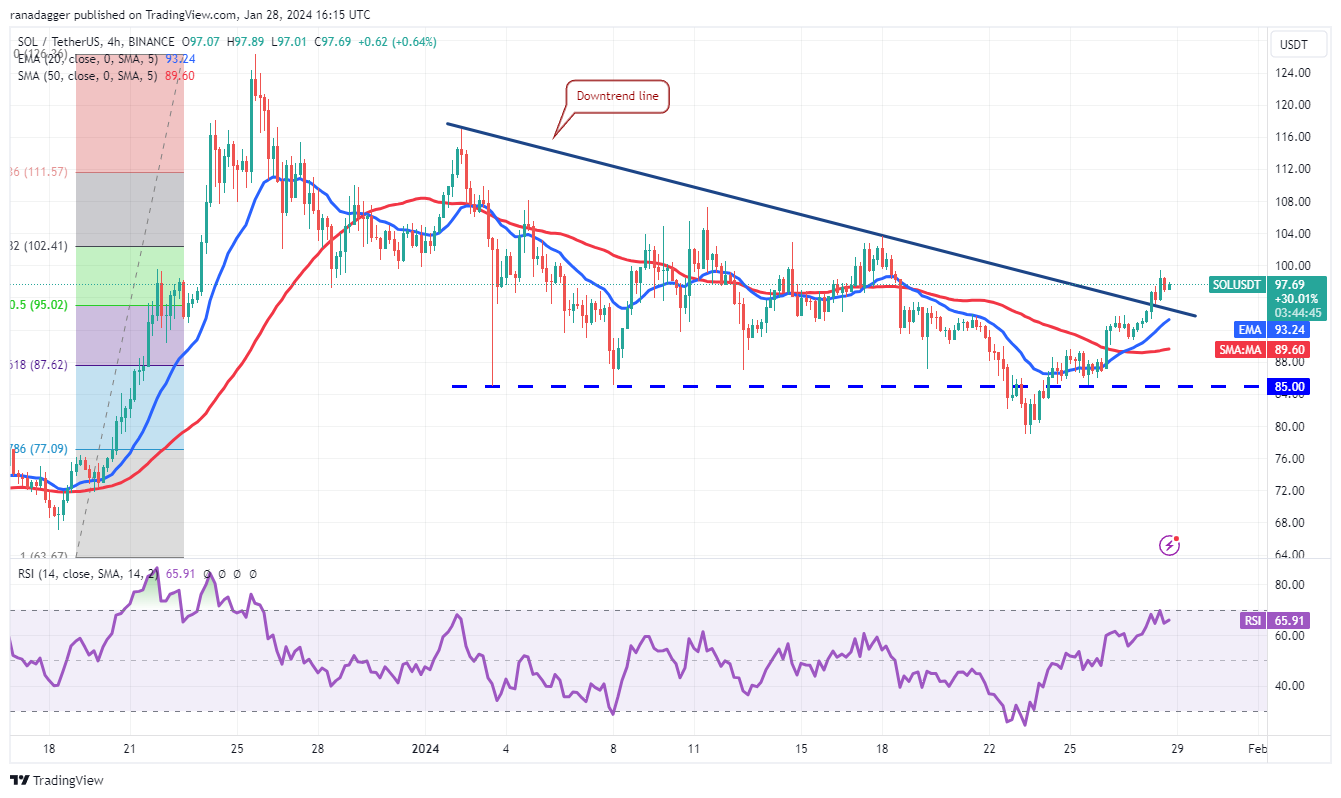
The pair invalidated the descending triangle formation on the four-hour chart by breaking above the downtrend line. This is a positive sign due to the entry of bulls waiting on the sidelines and bears rushing to exit. If buyers keep the price above the downtrend line, it is likely that Solana will rise to $107 and then to $117. This positive outlook will be invalidated in the near term if the price falls and goes below $85.
Avax Chart Analysis
Avax has been trading within a decreasing channel formation for several days. Buyers bought the dip to the support line on January 23 and lifted the price above the 20-day EMA level of $34 on January 28.
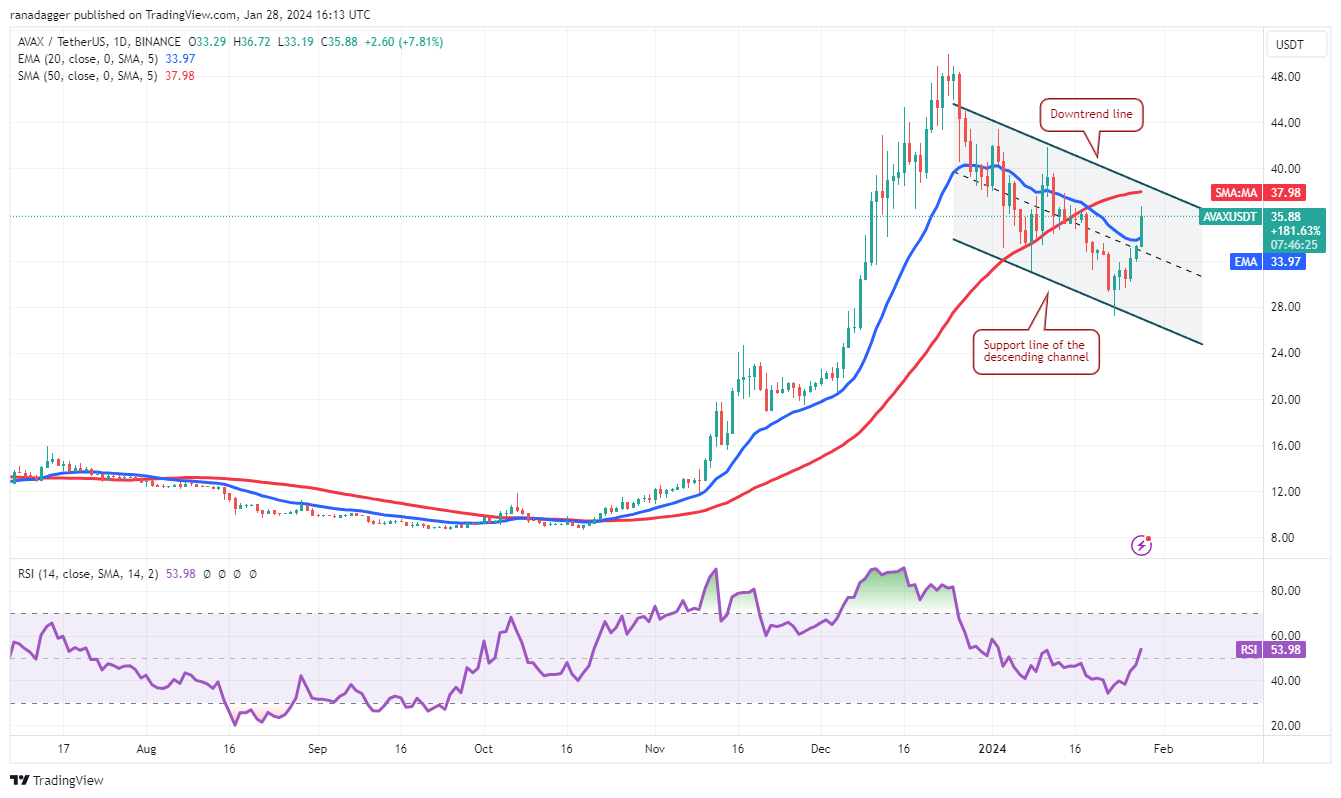
Sellers will try to stop the recovery at the downtrend line. If the price turns down from the overall resistance, it will indicate that bears remain active at higher levels. The AVAX/USDT pair may then spend some more time within the channel. Instead, if the price overcomes the general resistance, it will signal aggressive buying by the bulls. The pair could gain momentum and rise to the $44 level and then to the psychologically important $50 level.
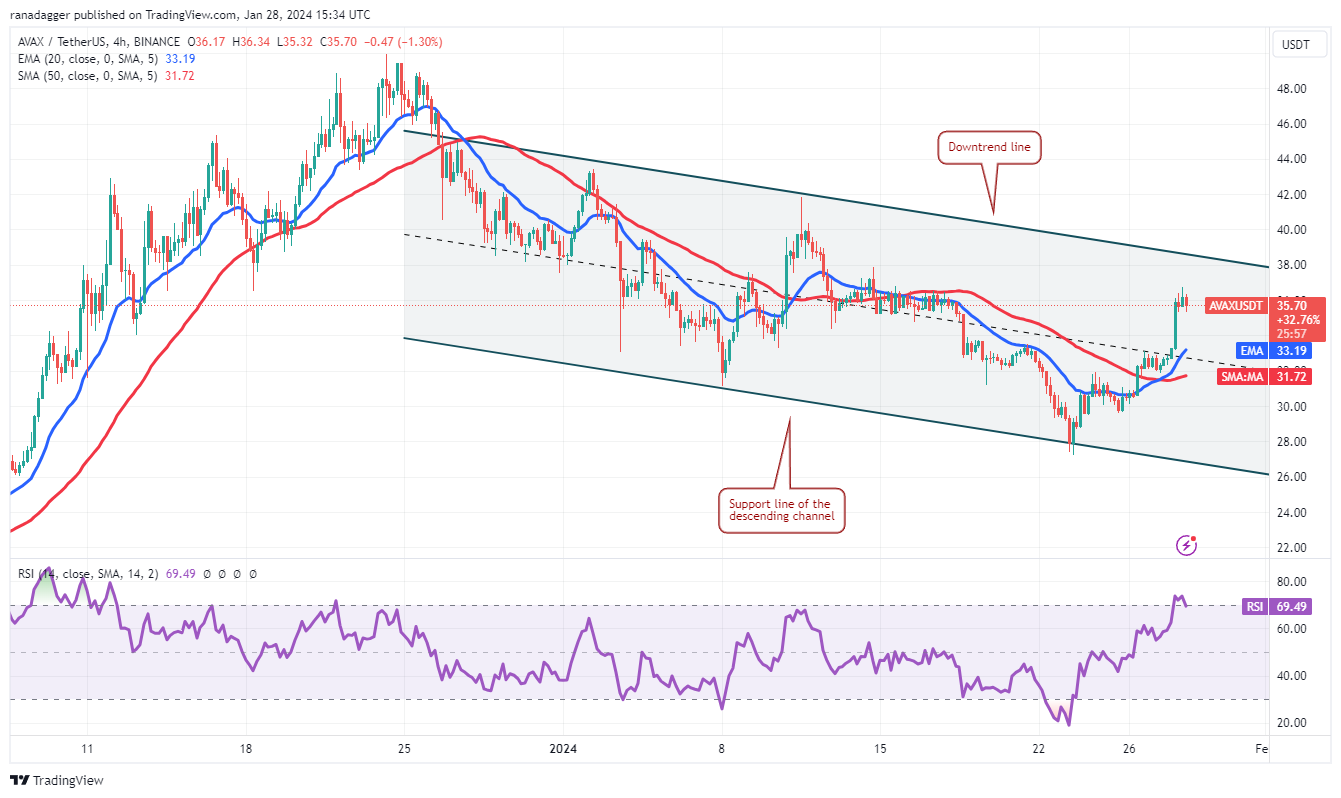
The EMA 20 average has started to rise and the RSI is near the overbought zone, indicating strong buying by the bulls. Sellers have successfully defended the downtrend line three times before and will try to do so again.
If the price turns down from the downtrend line but the EMA 20 recovers, it will show that investors see the dips as a buying opportunity. This will increase the likelihood of a rally above the channel. If this occurs, the pair could initiate a move towards $44.


