Volumes have decreased, and profit-taking in altcoins has painted them red for several days. The last weekly close was also discouraging. No one can say that cryptocurrencies will always rise, but it doesn’t seem logical for the declines to continue for a long time, especially when 2024 looks so enchanting. So, what’s next?
Bitcoin (BTC) Chart Analysis
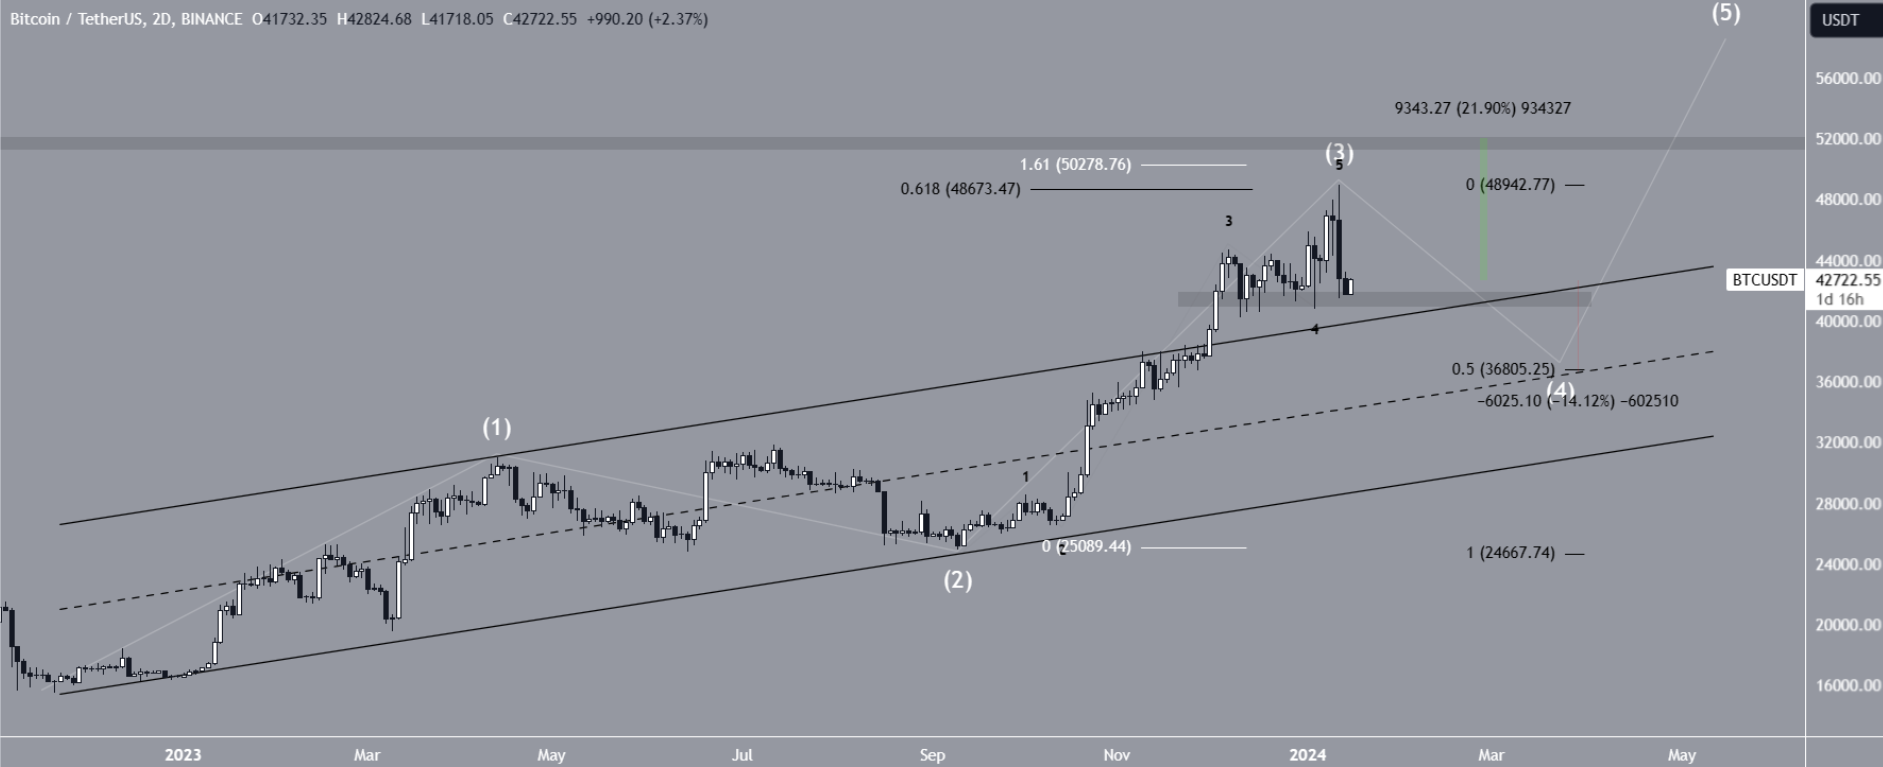
Elliott wave counting can help us understand the ongoing movement. The most likely count on the two-day chart indicates we have reached a local peak. Technical analysts often use Elliott wave counting, and it tells us we are in the fourth wave of a five-wave upward movement.

Sub-wave counting (black) shows that the price has completed an extended third wave, approximately 1.61 times larger than the first wave. The critical region for Bitcoin is at $41,500, and if this horizontal support area is lost, we could see the price drop to $36,800 with the fourth wave. This reading, which indicates a retreat of about 14% from the current price, could lead to 2-3 times greater losses in altcoins.
Moreover, we can see that the correction mentioned due to the length of the second wave could extend up to 6-8 weeks. To invalidate the downtrend, BTC needs to quickly close above $49,050. In a bullish scenario, the target could be a 22% increase to $52,000.
Solana (SOL) Chart Analysis
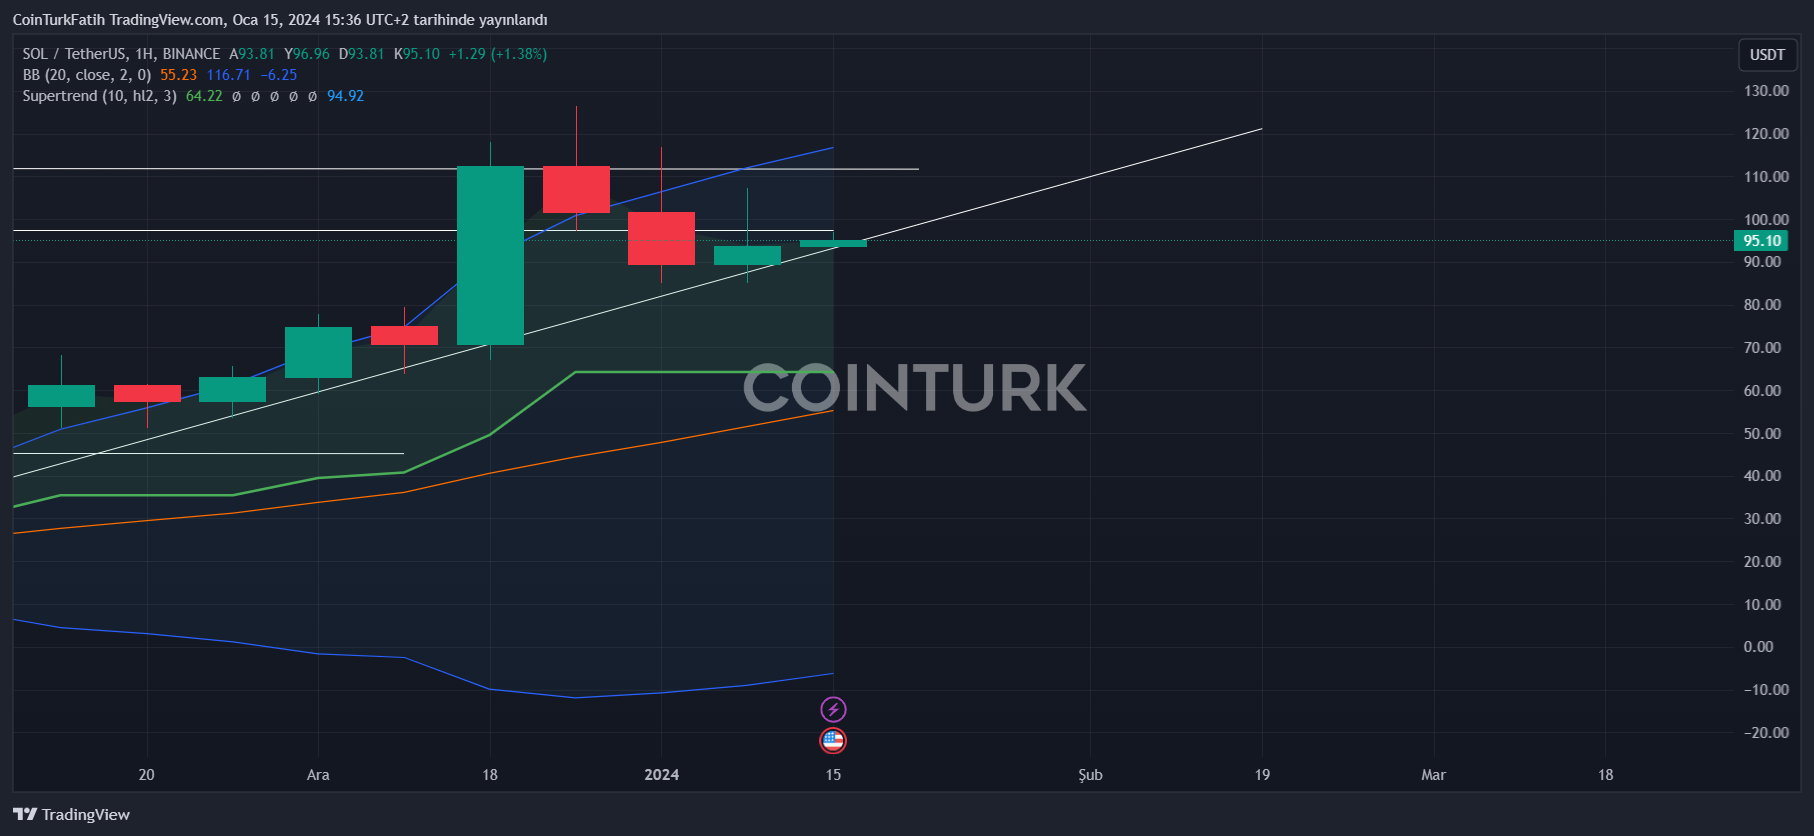
SOL Coin, consistently one of the most interesting altcoins in terms of volume, is still at the top today. The price has dropped below $100 again, but it is trying to hold at $95. The ongoing growth in the Solana ecosystem and the appetite for triple-digit peaks seem to keep SOL Coin investors away from selling for now.

However, if BTC starts a few weeks of a downtrend, it will be hard for SOL Coin investors to withstand. The rising trend line we previously highlighted is being preserved, but we need closures above $97.6. If this is not achieved, SOL Coin’s price could drop to the thresholds of $86 and $64-67. Below that, the target for extreme sell-offs would be a deep dip down to $45.

 Türkçe
 Español


