In recent weeks, the cryptocurrency market has seen declines in gains, primarily due to processes handled by the SEC. The postponement of Ethereum ETF applications has led to selling pressure on Ethereum and several other altcoin projects. We are examining what might be expected for Pepe and Arweave with detailed chart analysis and key levels.
Pepe Chart Analysis
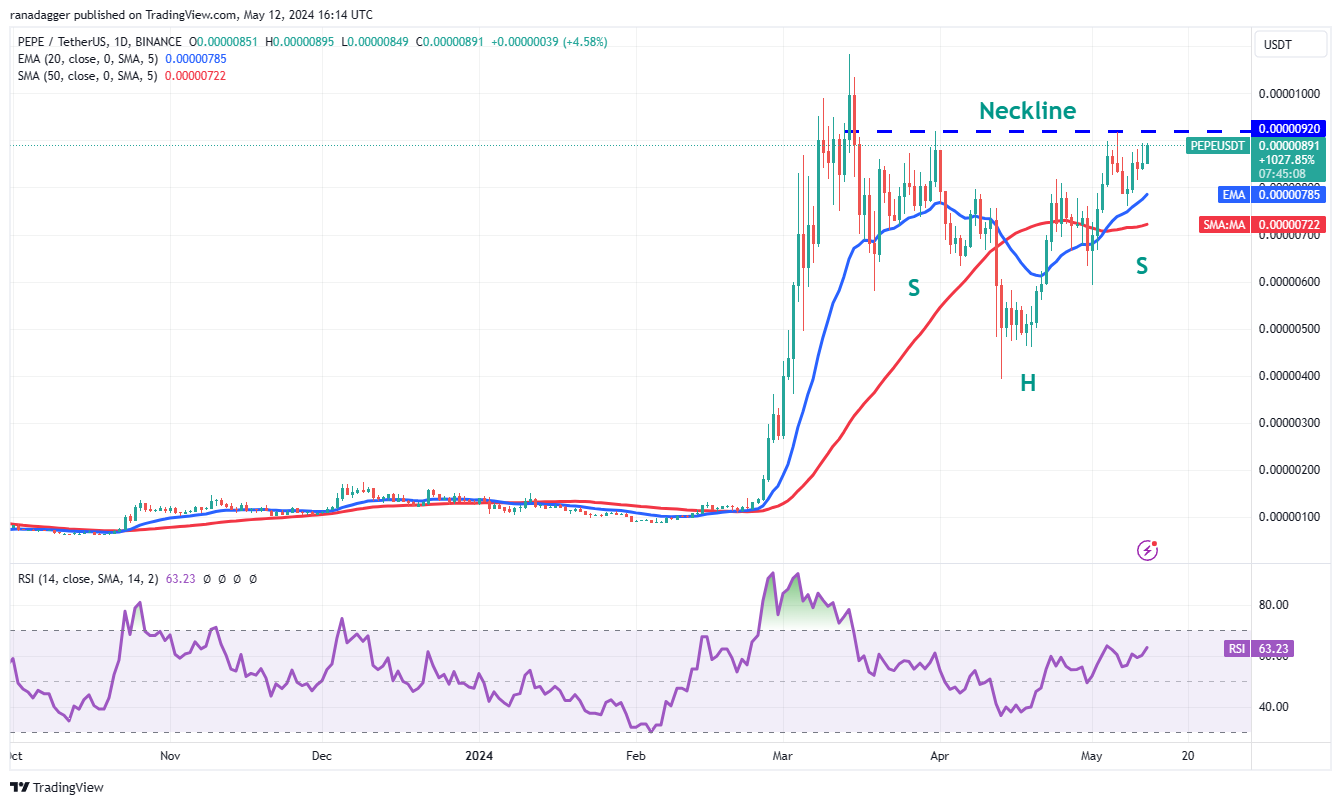
Pepe has been recovering steadily over the last few days, indicating that purchases at lower levels continue. The price movement has formed an inverse head-and-shoulders pattern, which will be completed with a breakout above $0.0000092. If buyers keep the price above the neckline, the PEPE/USDT pair may continue its upward trend. The formation target of the bullish setup is $0.0000145.

Moving averages are likely to act as strong support during pullbacks. A recovery above the moving averages will indicate that sentiment remains positive and investors are buying the dips. If the $0.0000060 support breaks, the trend could turn negative in the near term.

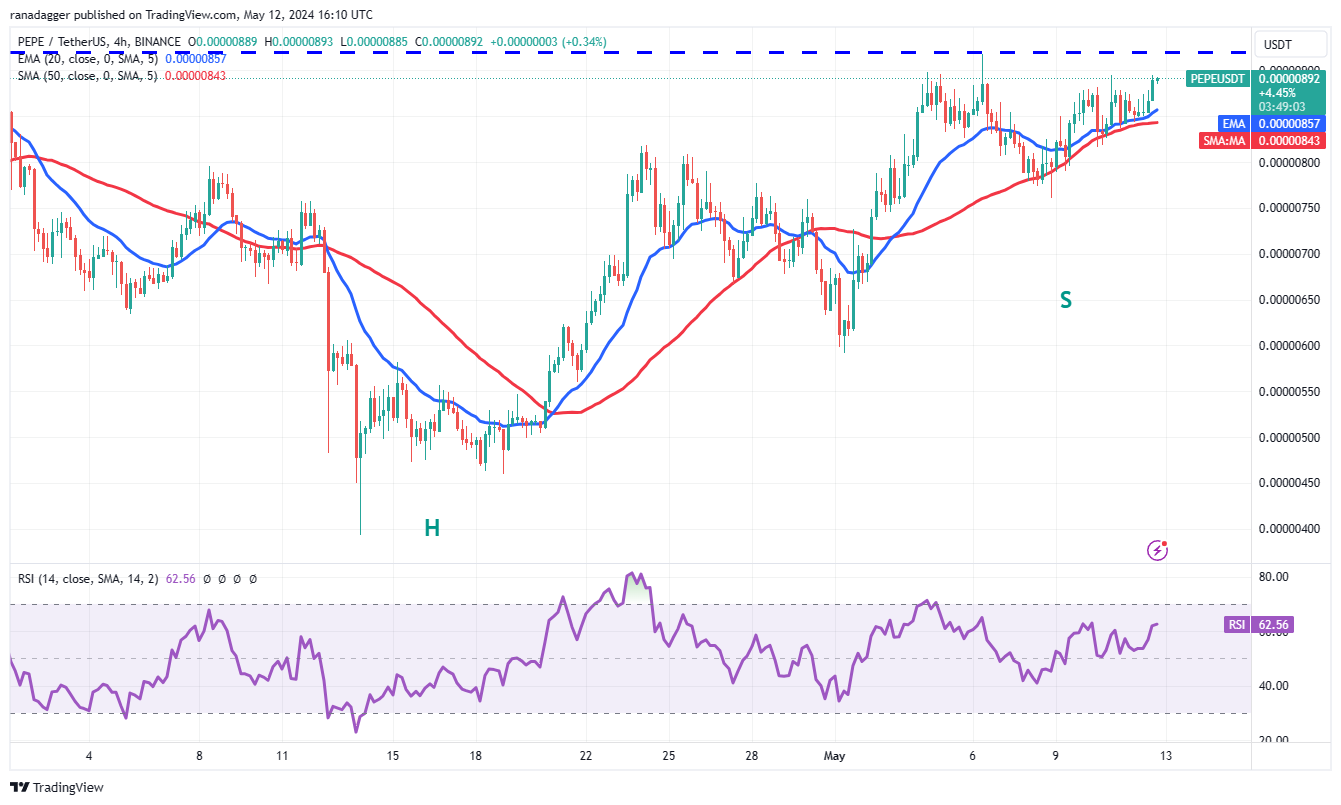
The 4-hour chart shows that the pair is receiving support at the moving averages, indicating that bulls are fiercely defending the level. Buyers need to overcome the general barrier of $0.0000092. A fall in price and a break below the moving averages would indicate that bears are returning to the game. The price could then slide to the critical support at $0.0000076, which is likely to witness strong buying from the bulls.
Arweave Chart Analysis
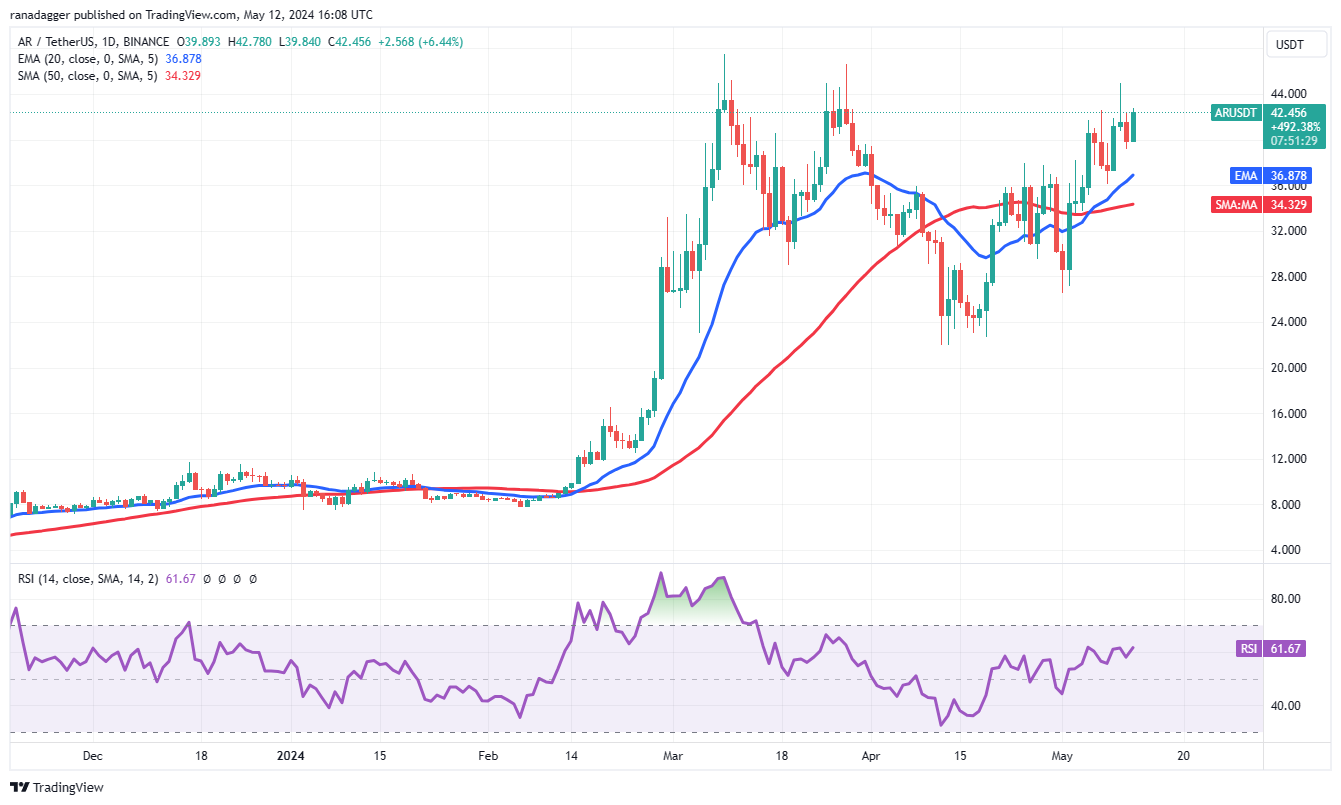
Arweave (AR) has been gradually rising over the last few days, indicating strong demand from the bulls. The rising 20-day EMA at $36 and RSI above 61 indicate that bulls have the advantage. The AR/USDT pair could reach a critical resistance level at $47.51. If bulls push the price above this resistance, the pair could accelerate towards $52 and then $68.

If the pair retreats and breaks below the moving averages, this positive outlook could become invalid in the near term, potentially pulling the pair down to $26.50.

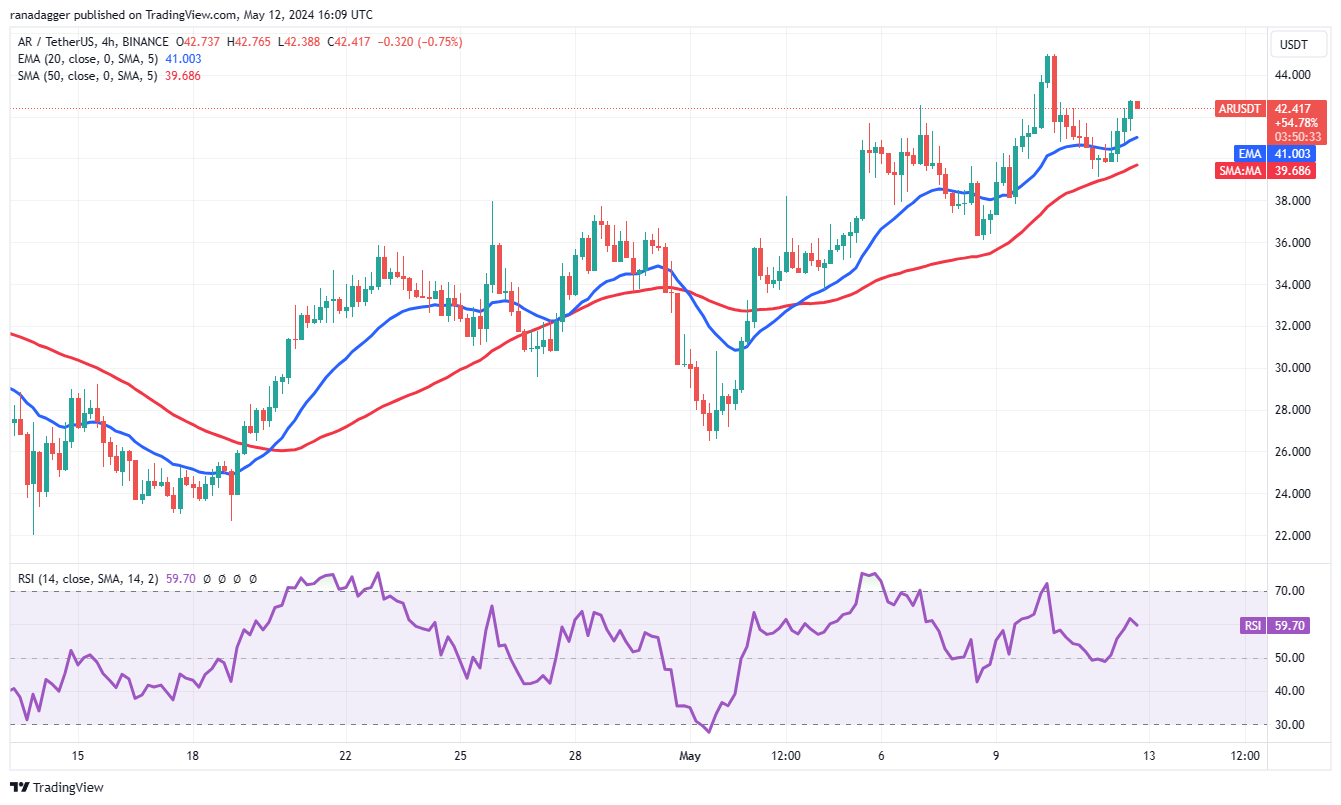
The 4-hour chart shows that during pullbacks, the pair is supported by the SMA 50. Buyers will try to push the price to $45 and then to $47.51. Strong defense by sellers in this area is expected because failure in their efforts could increase upward momentum.
The SMA 50 is a critical support to watch in a negative direction. If this level breaks, the pair could fall to $36 and then to $34. The price may recover from this region but is likely to encounter selling at the EMA 20.


