SEC ile potansiyel ETF ihraççılarının görüşmeleri devam ediyor. Sadece BlackRock bu ay SEC ile 5 farklı görüşme yaptı. Grayscale ise 4 görüşme gerçekleştirdi. Bunun dışında Fidelity, Hashdex ve diğer ETF başvuru sahiplerinin de görüşmeleri oldu. ETF görüşmeleri için en yoğun ay aralık oldu ve artık onayın yaklaştığına dair hisler en kuvvetli seviyesine ulaşıyor. Peki LTC Coin ne olacak?
Litecoin (LTC) Price Movements
Litecoin price has seen a gradual increase since August 17, with frequent corrective movements. The price is highly influenced by BTC fluctuations. On the other hand, due to significant sales during the halving period, investors prefer to remain cautious fearing deeper lows.
Weekly chart readings indicate that the downward trend line from the last bull season in 2021 continues to suppress the price. LTC first broke above this trend line in June 2023 but failed to maintain the upward movement, resulting in a false breakout.
After the decline, the LTC price broke above the trend line again in October but failed to sustain it. Currently, the RSI is in the neutral zone, and the price is struggling to maintain the $70 level. The situation looks promising as BTC remains above $44,100.
LTC Price Targets
Analysts seem more enthusiastic on the weekly chart. For instance, an analyst known as World Of Charts suggests that after breaking out from a long-term model, the price could climb to $300. Joao Devesa also shared a similar expectation, stating that LTC price could outperform Bitcoin.
“My predictions for the Litecoin price in the coming months.
Conservative target: $1250
Aggressive target: $6250
This is where the Litecoin price needs to go during the next bull run.”
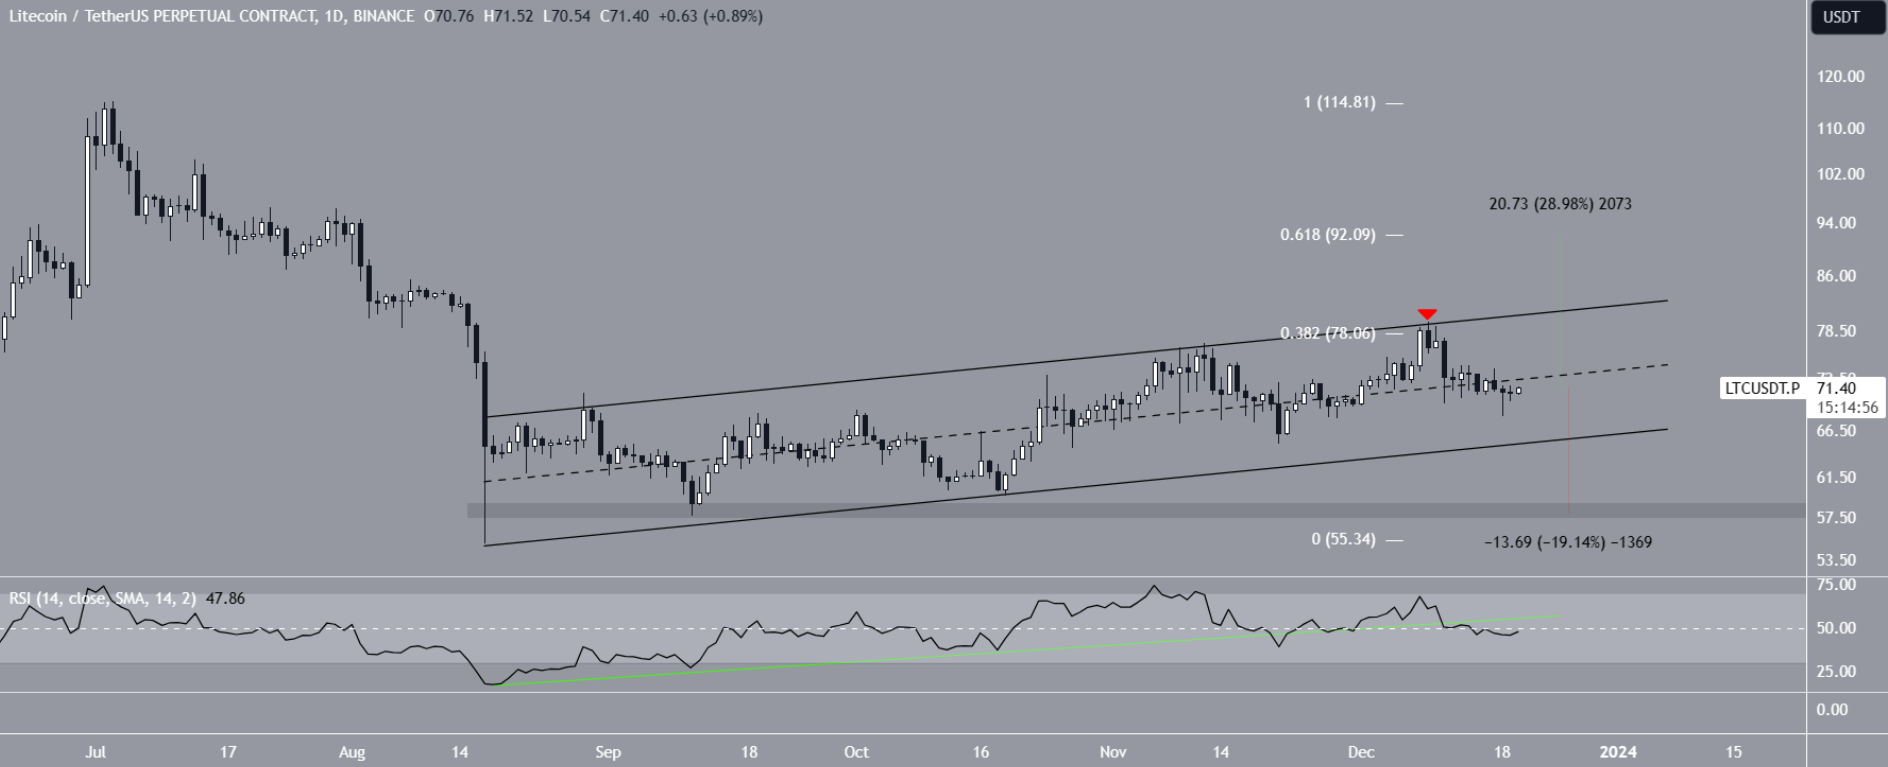
On the daily chart, the price has been rising since August 17 within an ascending parallel channel. Such channels often lead to corrective movements.

If the channel breaks downwards, a retracement to $58 is expected. However, if the LTC price breaks upwards, it could rise to $92. Analysts’ lofty targets often do not materialize, and they do not have the power to predict the future, so the daily chart’s support and resistance targets seem more sensible for at least the next few months.

 Türkçe
 Español


