With the latest developments in the cryptocurrency market, serious price corrections have occurred in the altcoin market. During this period, Bitcoin dominance continued to increase, and especially the growing optimism in spot Bitcoin ETF applications caused investors to turn to Bitcoin. So, what is happening with Dogecoin, the market’s largest memecoin project, during this process? Let’s take a look.
Dogecoin Chart Analysis
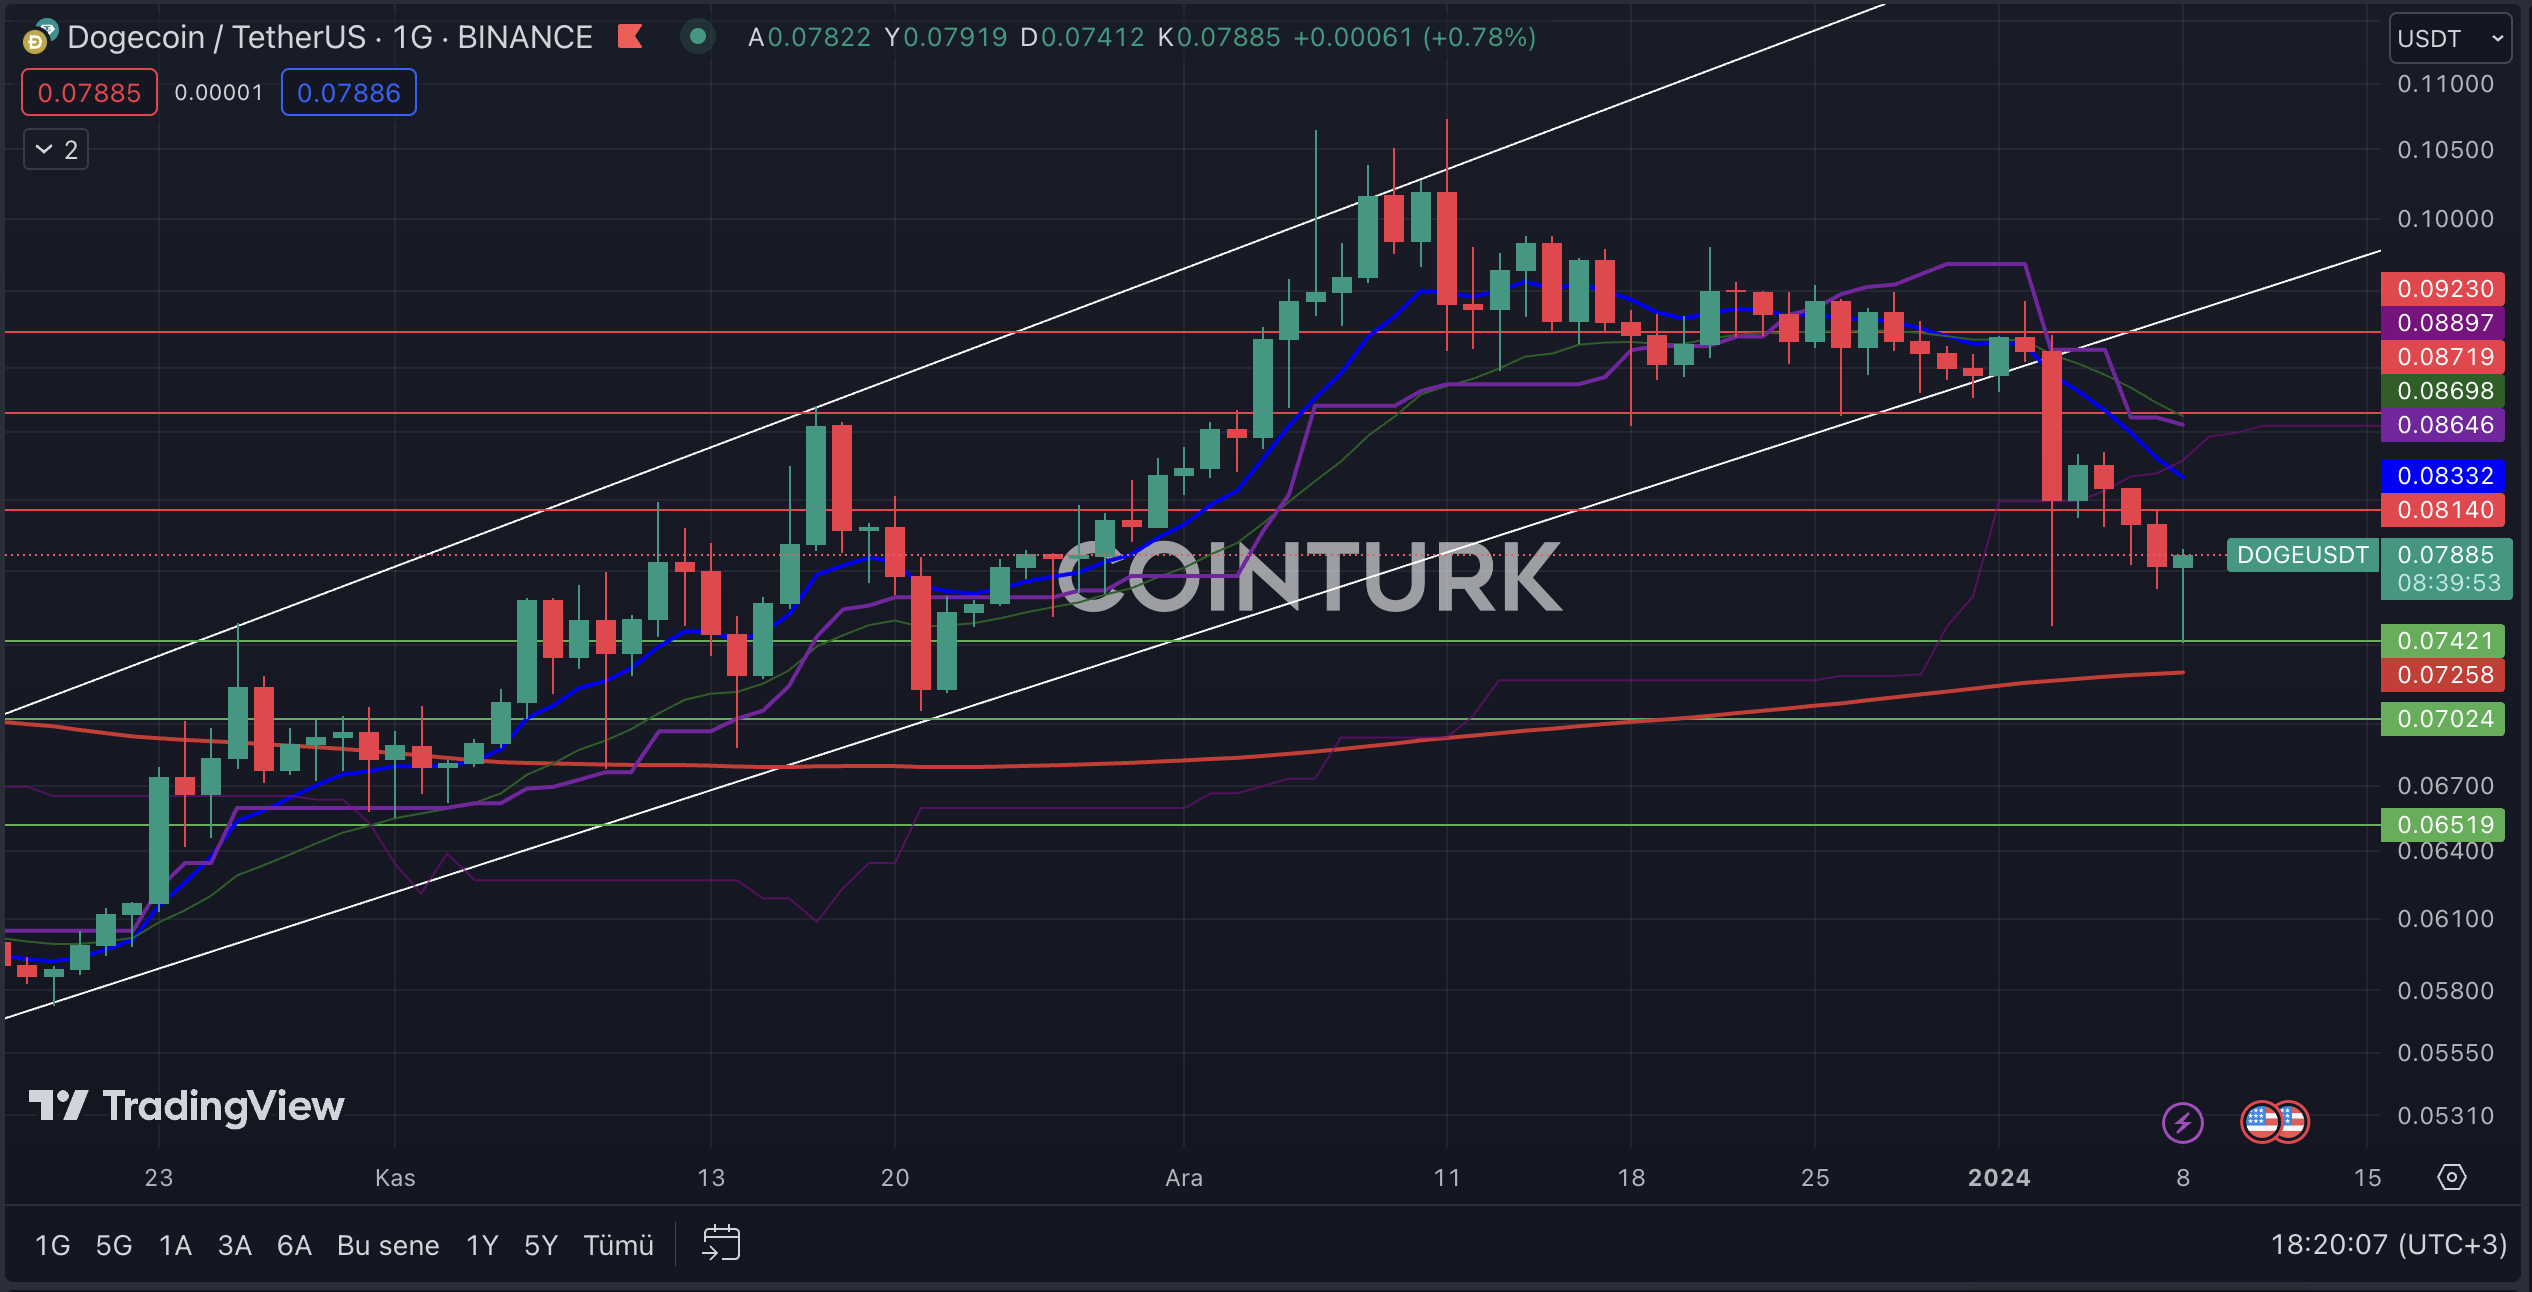
The daily DOGE chart was drawing attention with its ascending channel formation until the early days of 2024. However, the recent decline broke the support of the formation structure, and following this development, DOGE continues to face selling pressure. Support from the EMA 200 (red line) region, however, presents a positive scenario for the DOGE price.
The most important support levels to watch on the DOGE chart are, in order; 0.07421 / 0.07024 and 0.06519 dollars. Particularly, a daily bar close below the 0.07421 dollar level, which played a major role in the last two declines, could lead to a drop in the DOGE price.
The most important resistance levels to watch on the daily DOGE chart are, in order; 0.08140 / 0.08719 and 0.09230 dollars. Especially, a daily bar close above the 0.08140 dollar level, which was a significant barrier in the last upward move, will increase the momentum of the DOGE price.

Dogecoin Weekly Chart Analysis
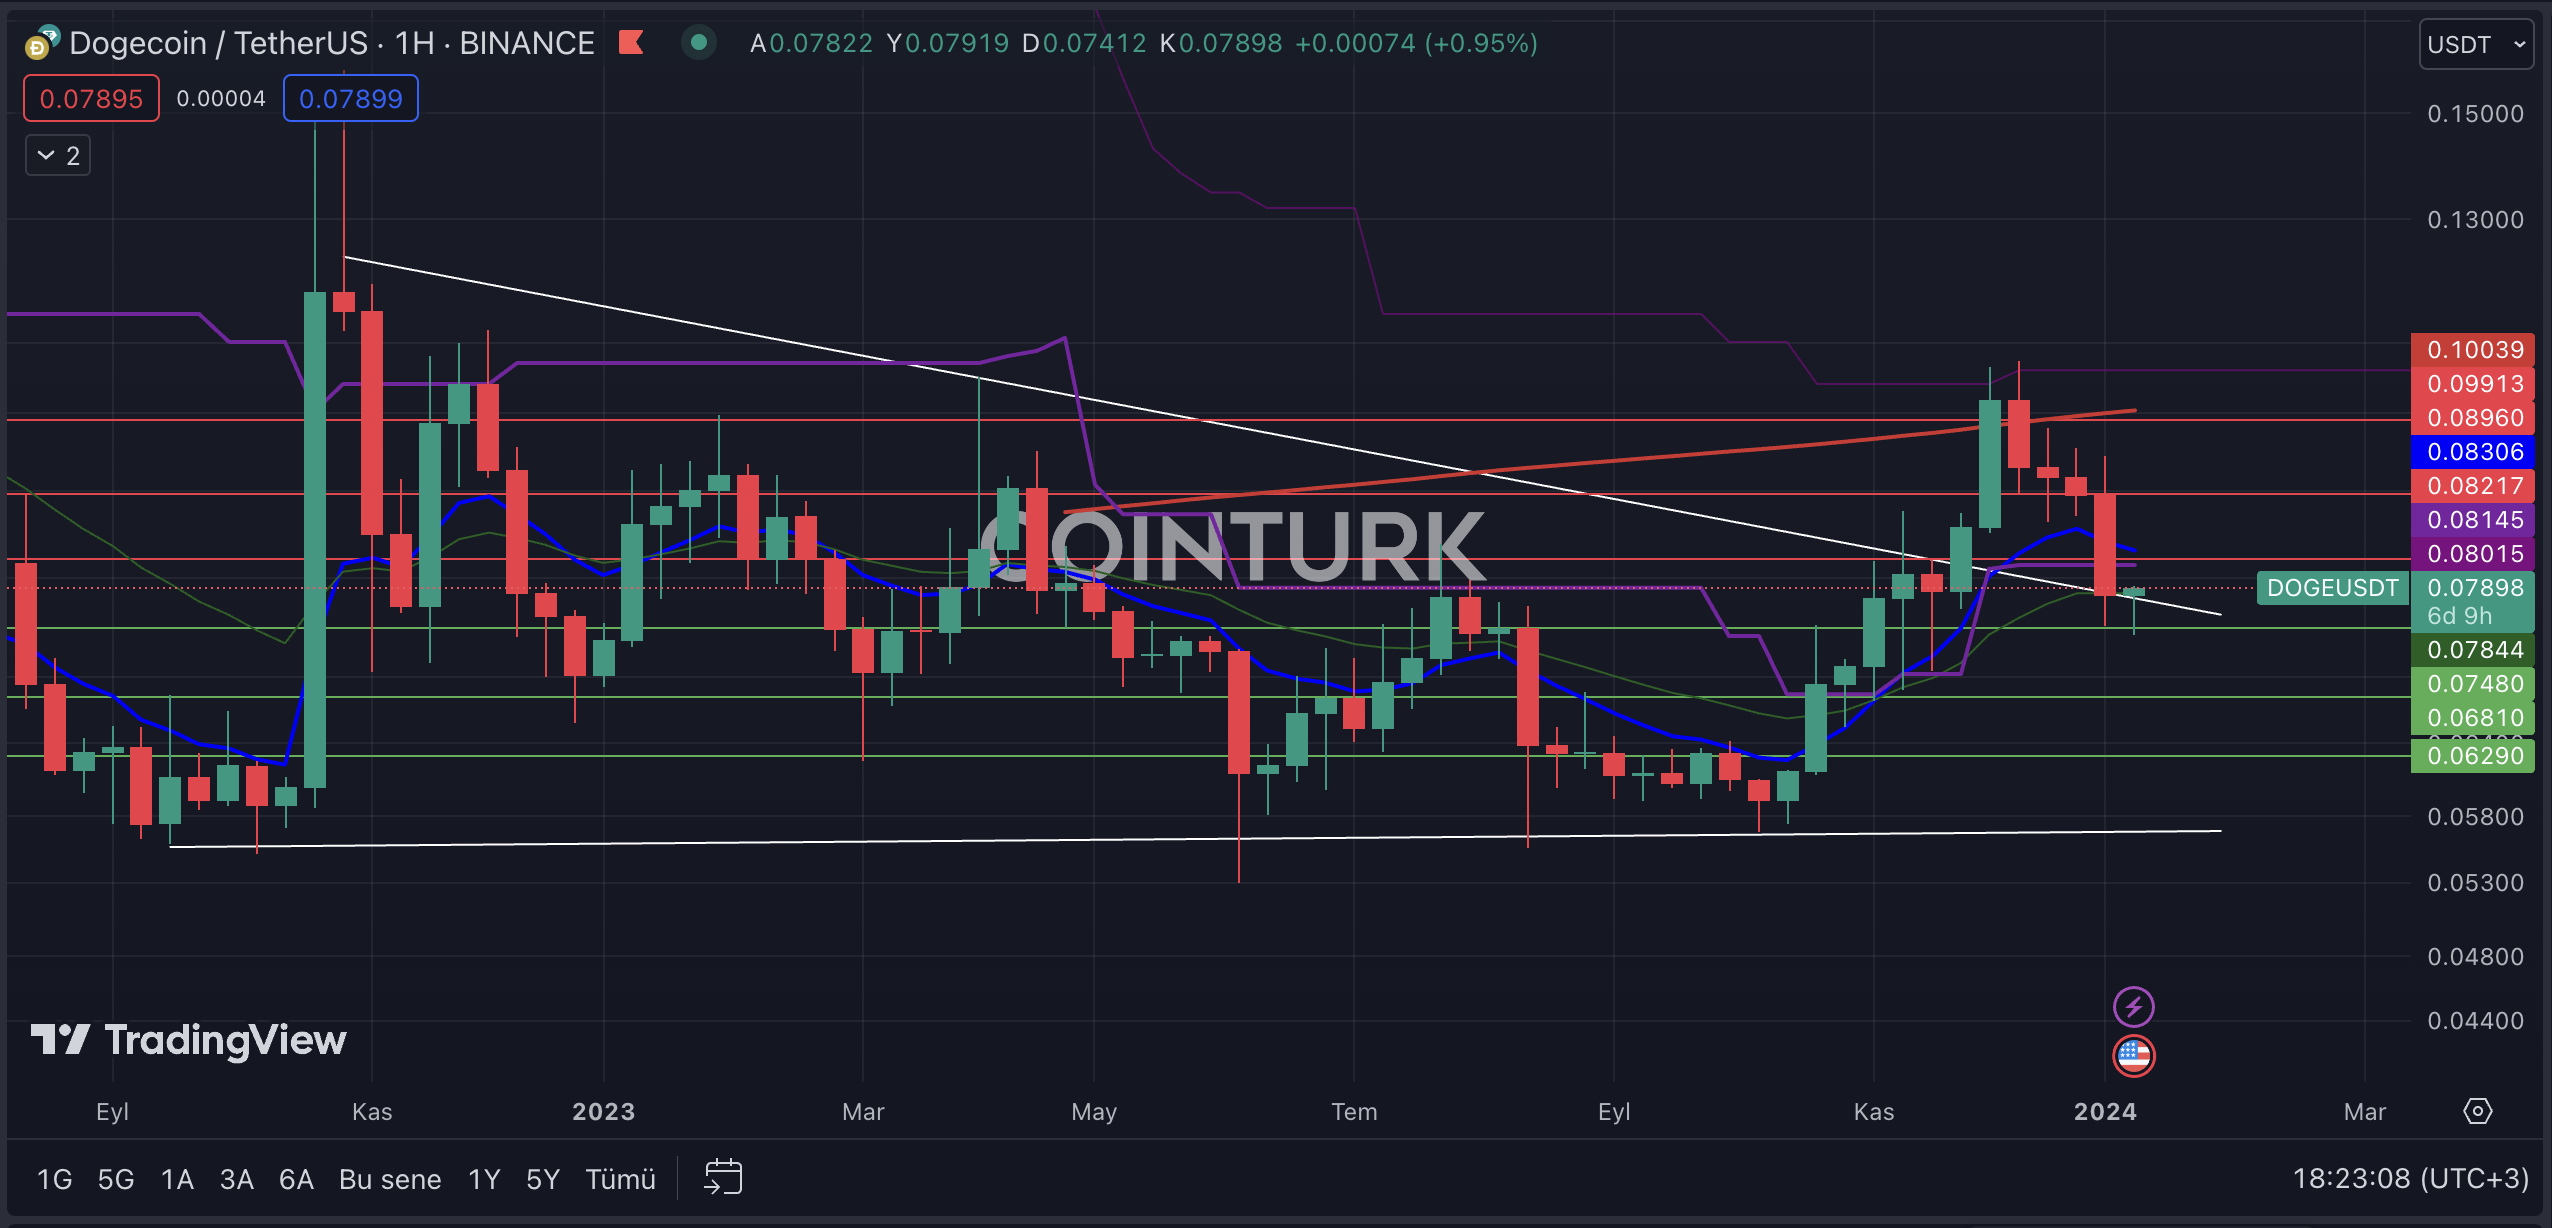
The first noticeable formation structure in the weekly Dogecoin chart is the contracting wedge formation. After breaking the resistance, DOGE, which encountered resistance at the EMA 200 level, could regain upward momentum if the formation resistance line acts as support. However, in the opposite case, a return to the formation area for DOGE could lead to contact with a potential support line and create significant selling pressure.
The most important support levels to watch on the weekly DOGE chart are, in order; 0.07480 / 0.06810 and 0.06290 dollars. Particularly, a weekly bar close below the 0.07480 dollar level, which played an important role in the formation of the last two bars, could lead to significant selling pressure on the DOGE price.
The most important resistance levels to watch on the DOGE chart are, in order; 0.08217 / 0.08960 and 0.09913 dollars. Especially, a weekly bar close above the 0.08217 dollar level, which intersects with the EMA 21 (blue line), will help the DOGE price gain momentum.


 Türkçe
 Español


