Altcoin king Ethereum continues to adapt to a stagnant market environment. At the time of writing, Ethereum is trading at $3398, experiencing a 0.71% decrease over the last 24 hours. This performance is notable compared to many other altcoins. So, what can be expected for Ethereum moving forward? Let’s take a look.
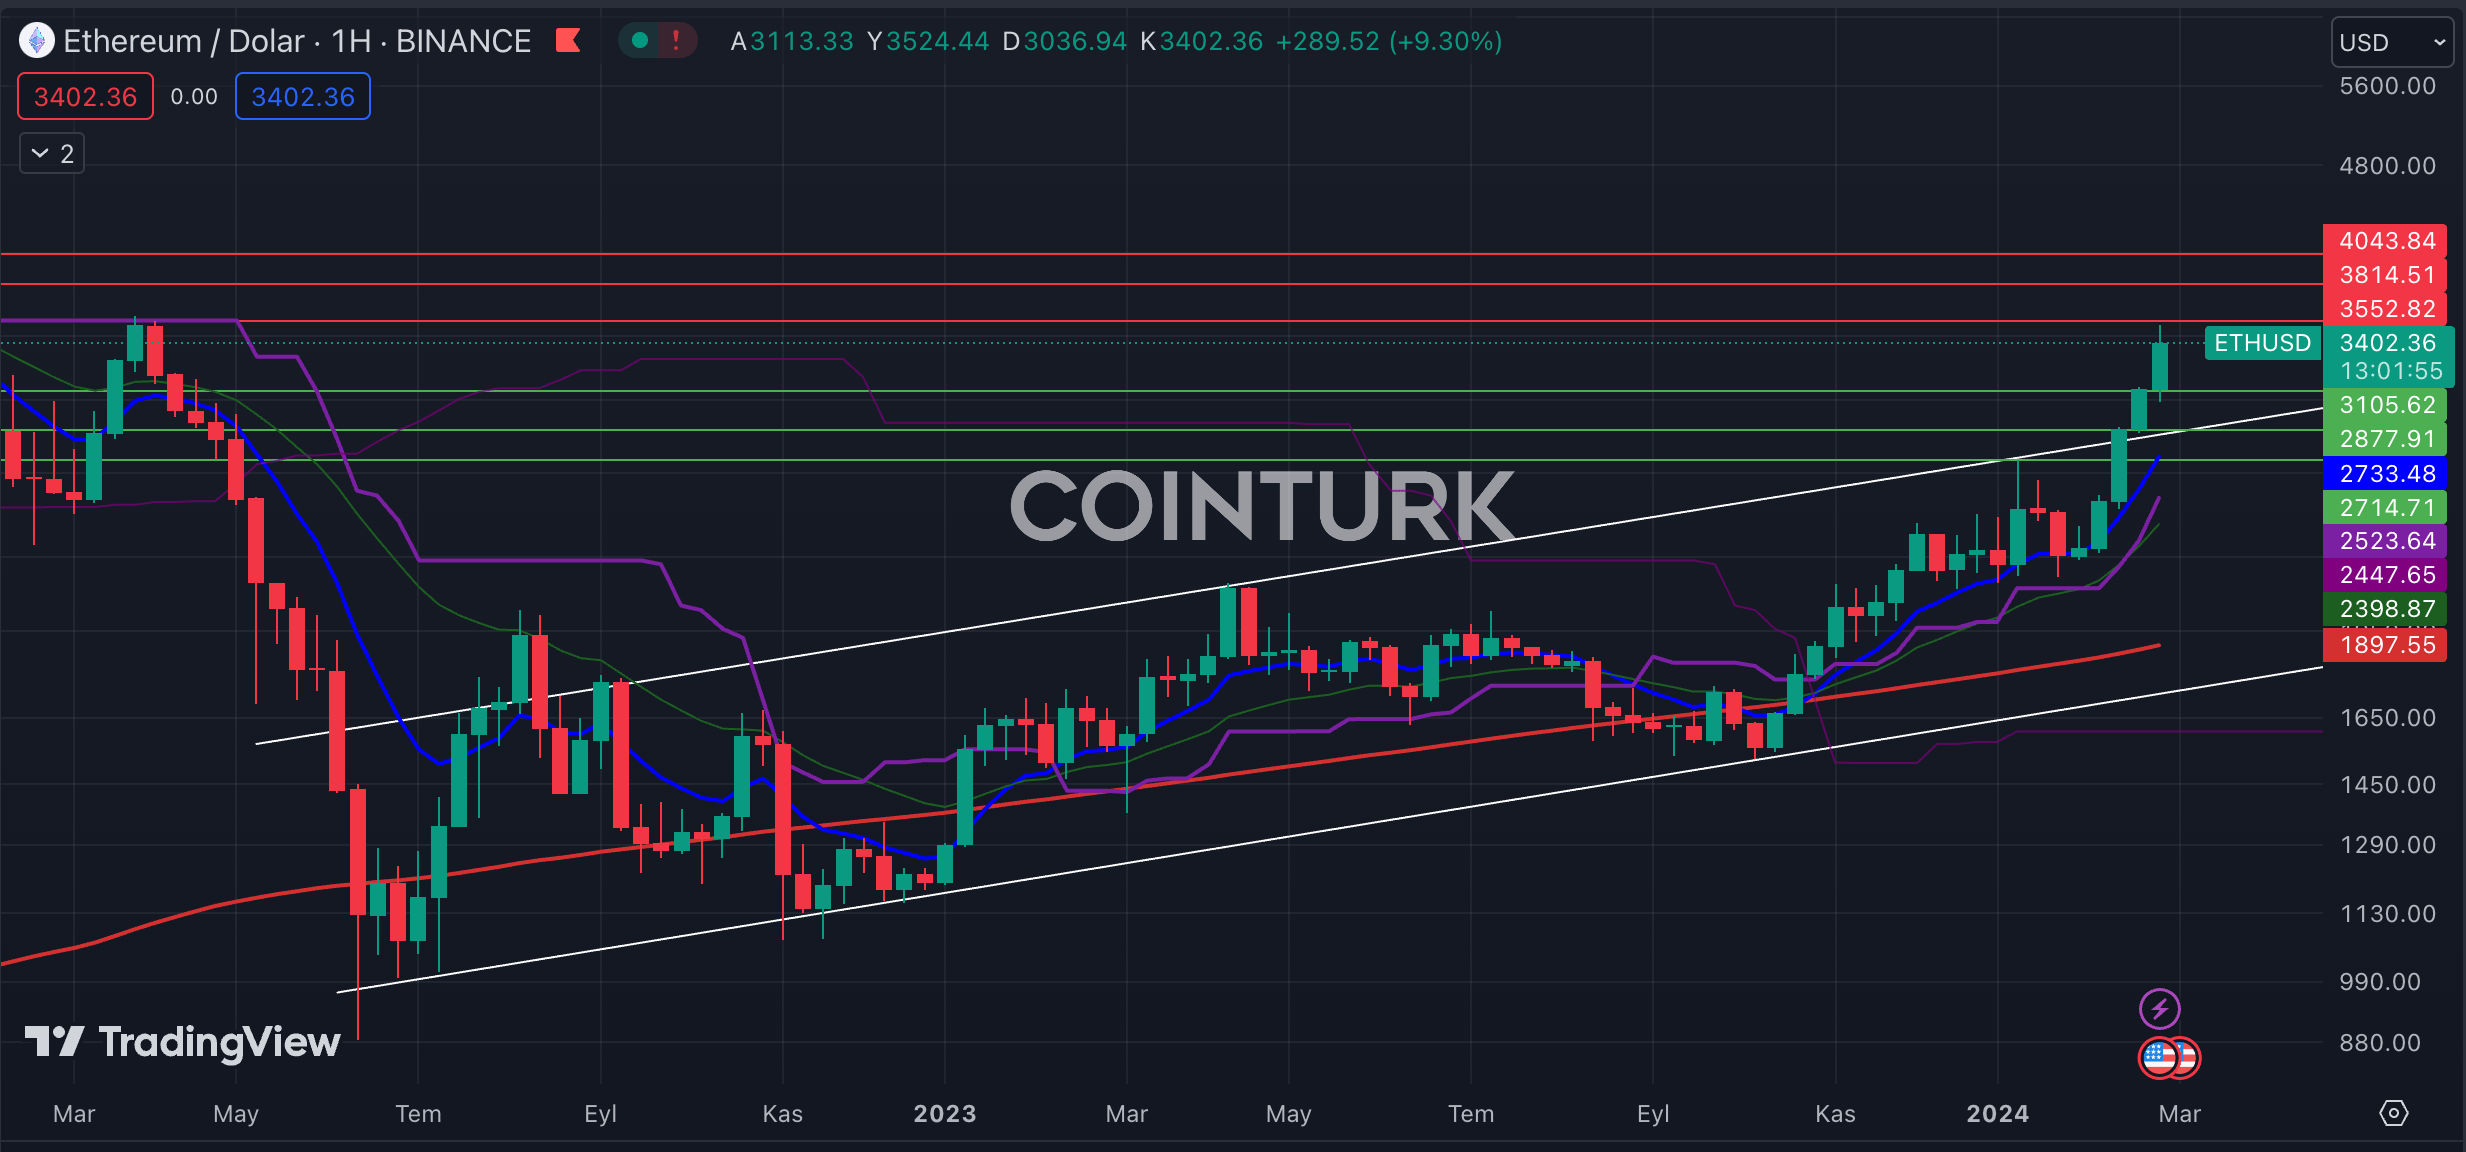
Ethereum Weekly Chart Analysis
Ethereum’s weekly chart shows a rising channel formation that has provided significant clues to investors, leading to a breakout on March 2nd. Following this breakout, Ethereum’s price continues to gain momentum.
The most important support levels to watch on the weekly Ethereum chart are $3105, $2877, and $2714, respectively. A weekly bar close below the significant support level of $3105 could lead to a loss of momentum for Ethereum’s price.
The most critical resistance levels to monitor on the weekly Ethereum chart are $3552, $3814, and $4043, respectively. A weekly bar close above the significant hurdle of $3552, encountered on March 3rd, would likely accelerate Ethereum’s upward momentum.

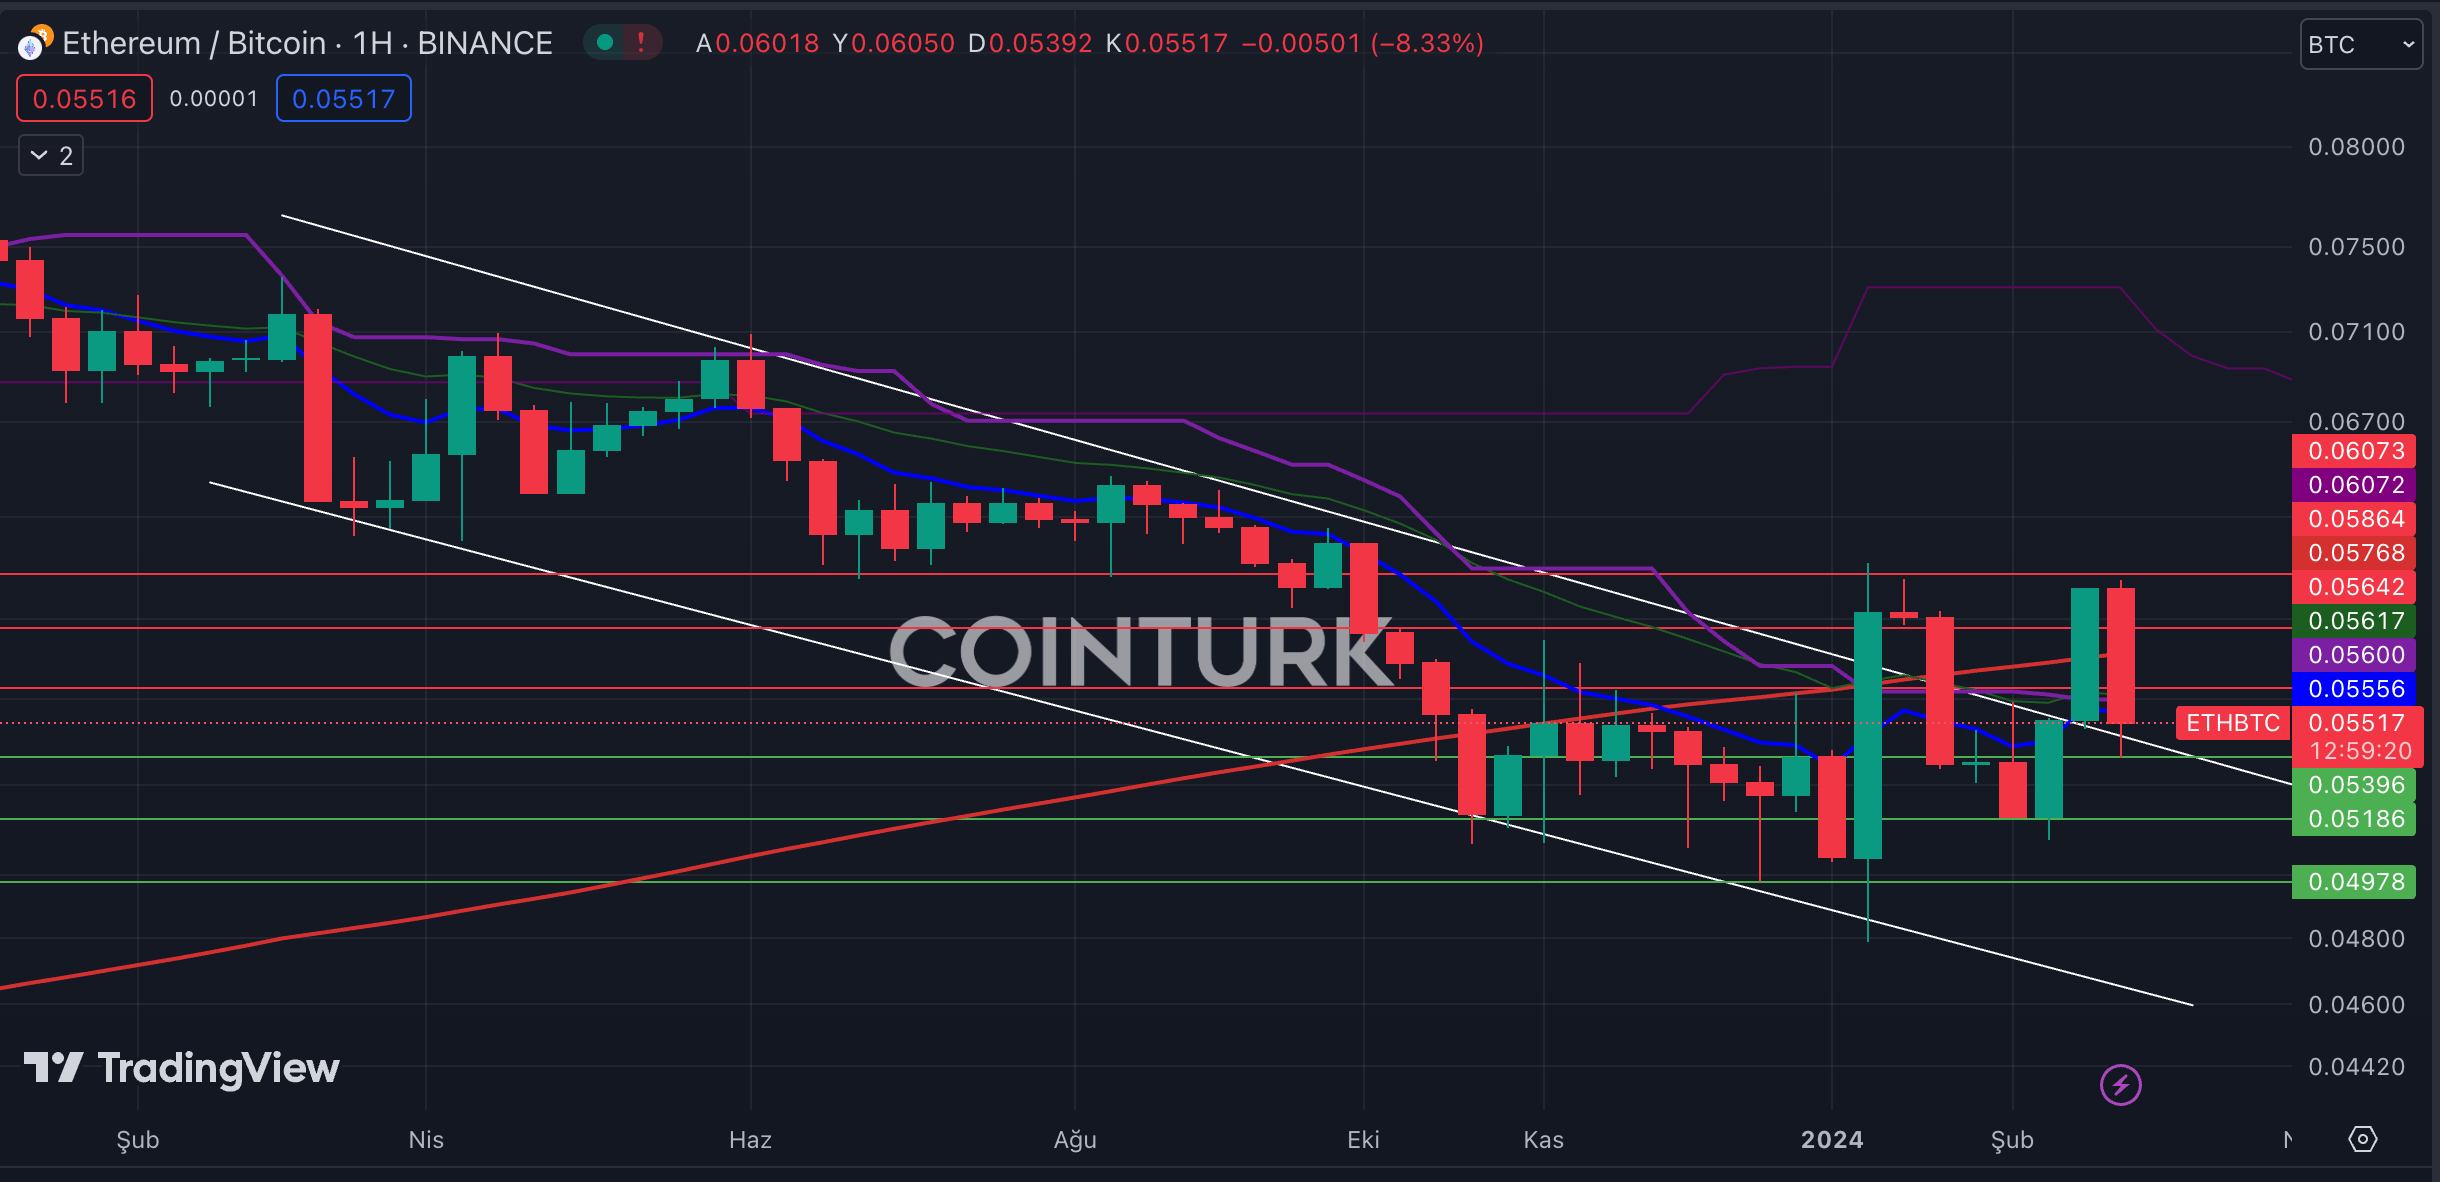
ETH/BTC Chart Analysis
The weekly ETH/BTC chart features a descending channel formation that offers important insights through support and resistance touches. A weekly bar close below the EMA 200 (red line) could suggest a negative long-term scenario for Ethereum. However, a weekly close at the current level of 0.5517 could indicate an upward trend within the formation.
Key support levels to follow on the ETH/BTC chart are 0.05396, 0.05186, and 0.04978, respectively. A weekly bar close below the critical level of 0.05396 could lead to Ethereum continuing to lose value against Bitcoin.
Important resistance levels to watch on the ETH/BTC chart are 0.05642, 0.05864, and 0.06073, respectively. A weekly bar close above the EMA 200 level, particularly above 0.05864, would likely foster an upward trend for Ethereum against Bitcoin.