Significant developments have taken place in the cryptocurrency markets in recent days. The addition of another victory to Ripple’s legal process has had a positive impact on the entire crypto market, especially XRP. Despite ongoing geopolitical issues and US macroeconomic data, the sustainability of this uptrend in the crypto market depends on the weekly closing levels. Now, let’s take a closer look at Ethereum.
Ethereum Chart Analysis
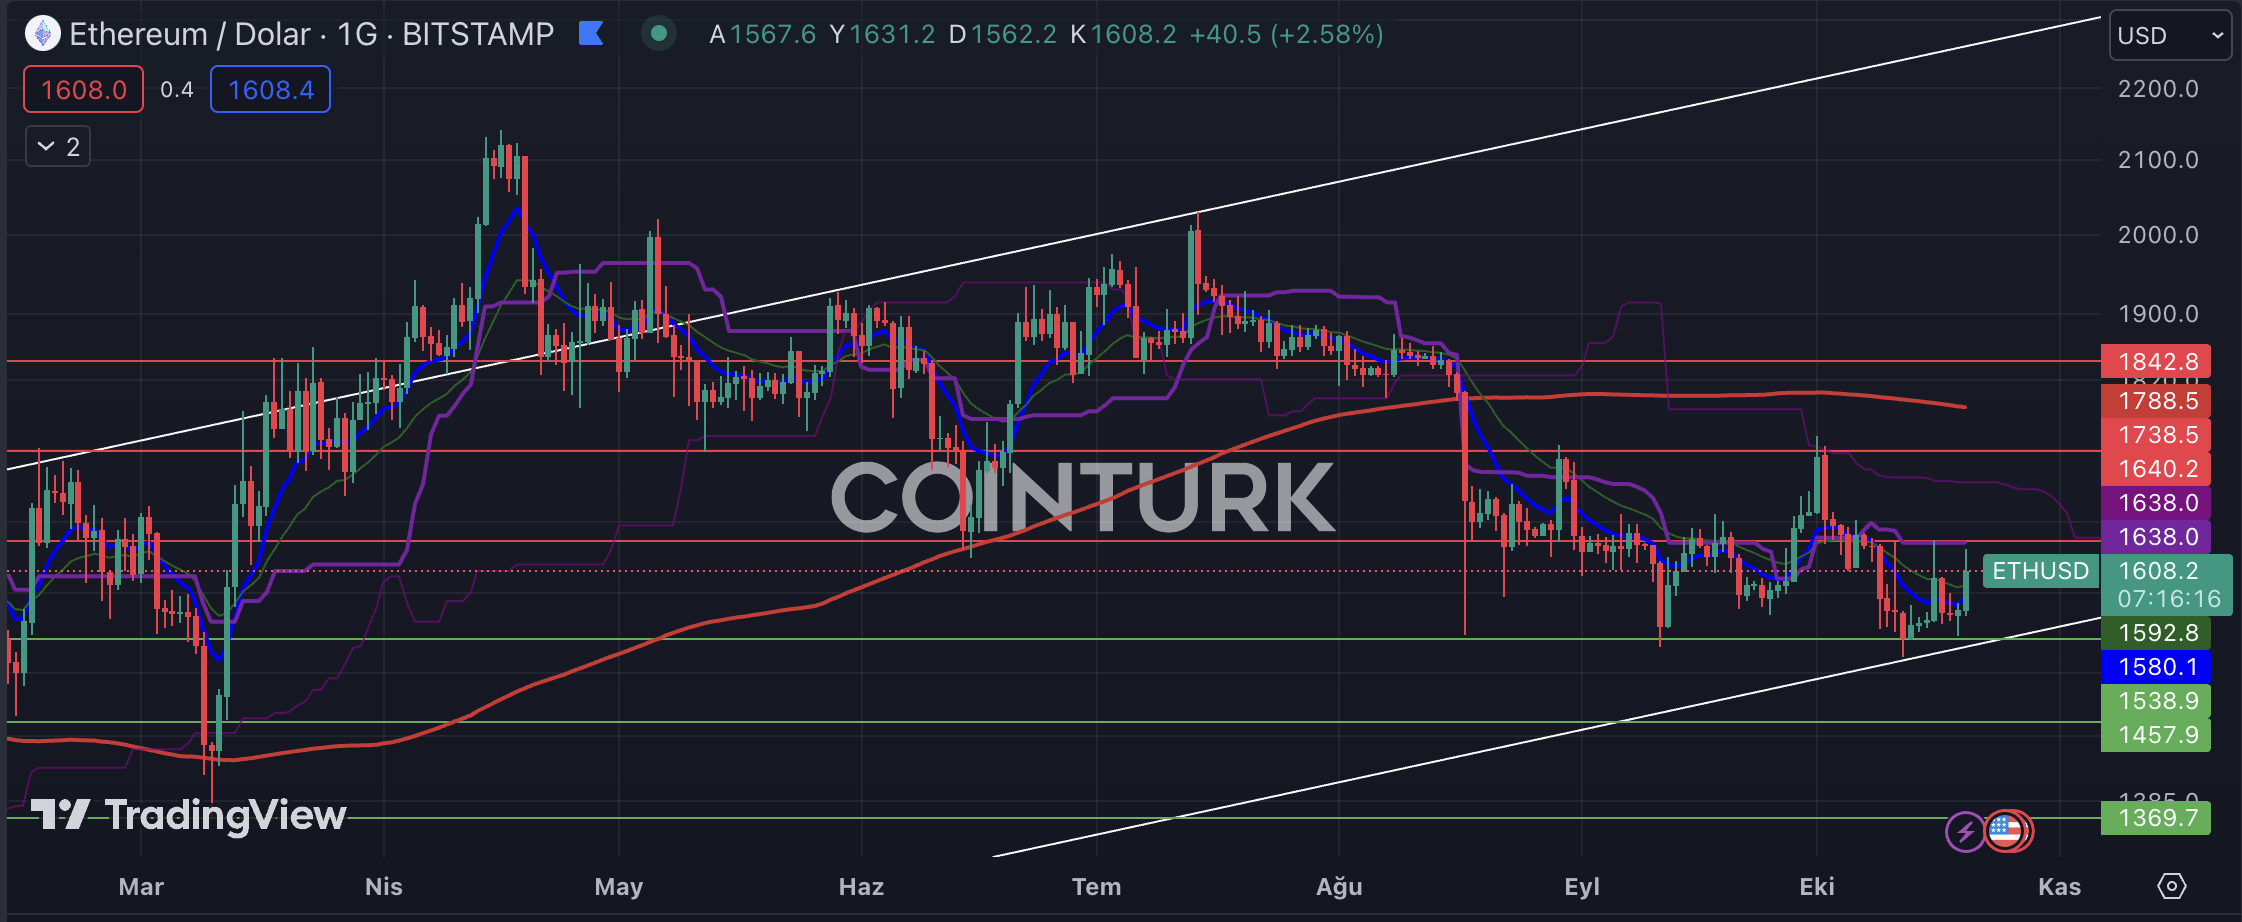
In June 2022, the bankruptcy of Terra resulted in significant losses across the entire cryptocurrency market. Since then, a support line on the Ethereum chart has continued to exist. After the support touch on October 19, there was an uptrend in the Ethereum price, and the working of the support has renewed the confidence of many investors.
The support levels to watch for on the daily Ethereum chart are $1538, $1457, and $1369, respectively. The critical role played by the $1538 level in the downturns since August indicates its vital importance. If the daily bar closes below the support level that has been working for the past two weeks, it will accelerate the price decline.
The resistance levels to watch for on the Ethereum daily chart are $1640, $1738, and $1842, respectively. The $1738 level stands out as a notable support level in recent significant price increases. A daily bar closing above this level will help the price uptrend gain momentum.

ETH/BTC Chart Analysis
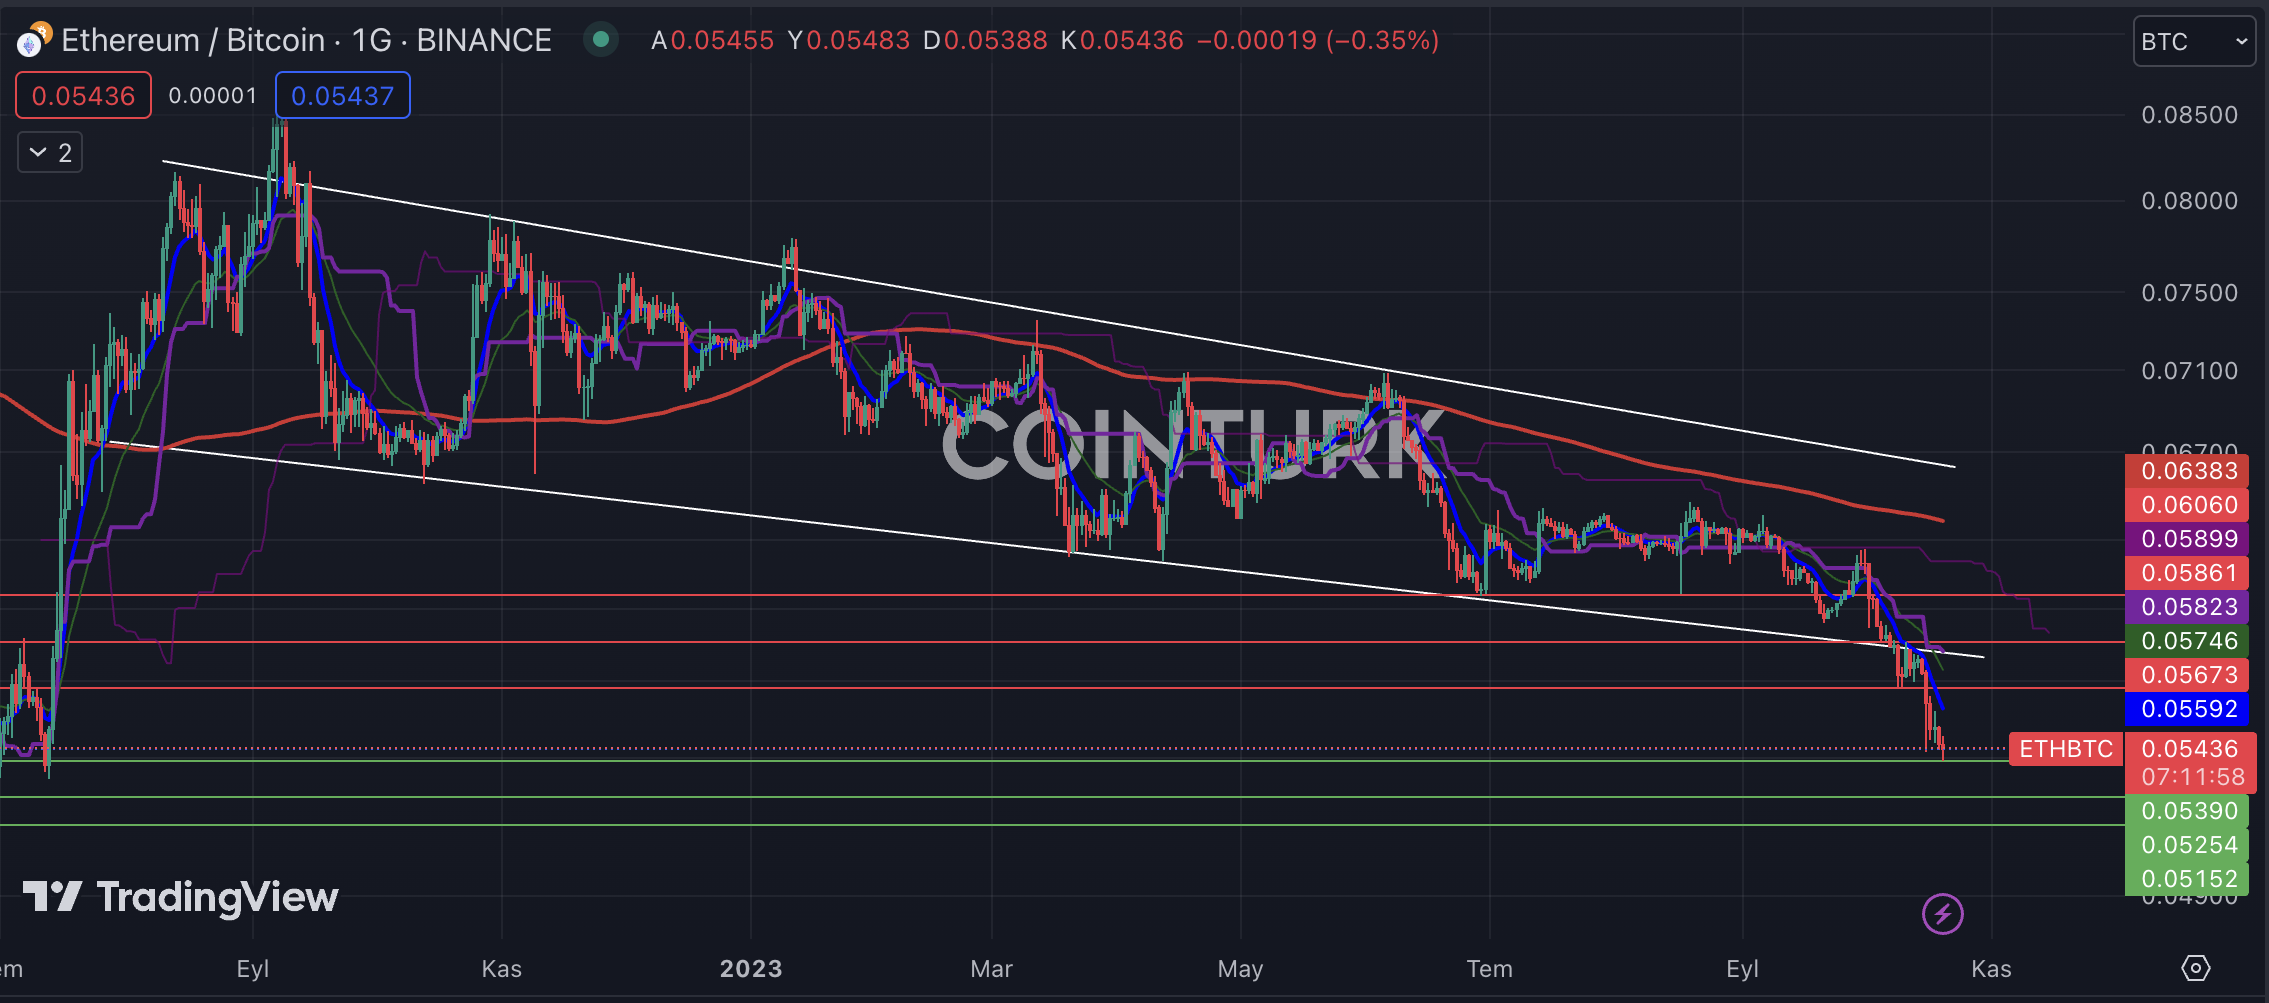
Since September 2022, there has been a significant decline in the ETH/BTC chart. This decline indicates Ethereum’s loss of strength against Bitcoin. Factors such as decreasing investor interest in the Ethereum network, the popularity of Layer-2 networks, and market losses in the NFT market play a major role in the weakening of the ETH price. The working of the descending channel formation has led to a significant drop in the pair.
The support levels to watch for on the ETH/BTC pair are 0.05390, 0.05254, and 0.05152, respectively. The fact that the 0.05390 level has not been broken since July 2022 highlights the importance of this support, and a possible breakthrough will accelerate Ethereum’s loss of value.
The resistance levels to watch for on the ETH/BTC pair are 0.05673, 0.05861, and 0.06060, respectively. Specifically, a breakthrough of the 0.05861 level will lead to a return to the formation and enable Ethereum to gain value against Bitcoin.


