Türkçe
 Español


The cryptocurrency market, particularly for Ethereum investors, seems to be heading towards an exciting period. The price of Ethereum has recently entered a consolidation phase above the $3,450 support zone. However, the real issue now is whether Ethereum can overcome the barriers it faces to start a new rally. So, what are these barriers?
Ethereum Price Faces Critical Barriers
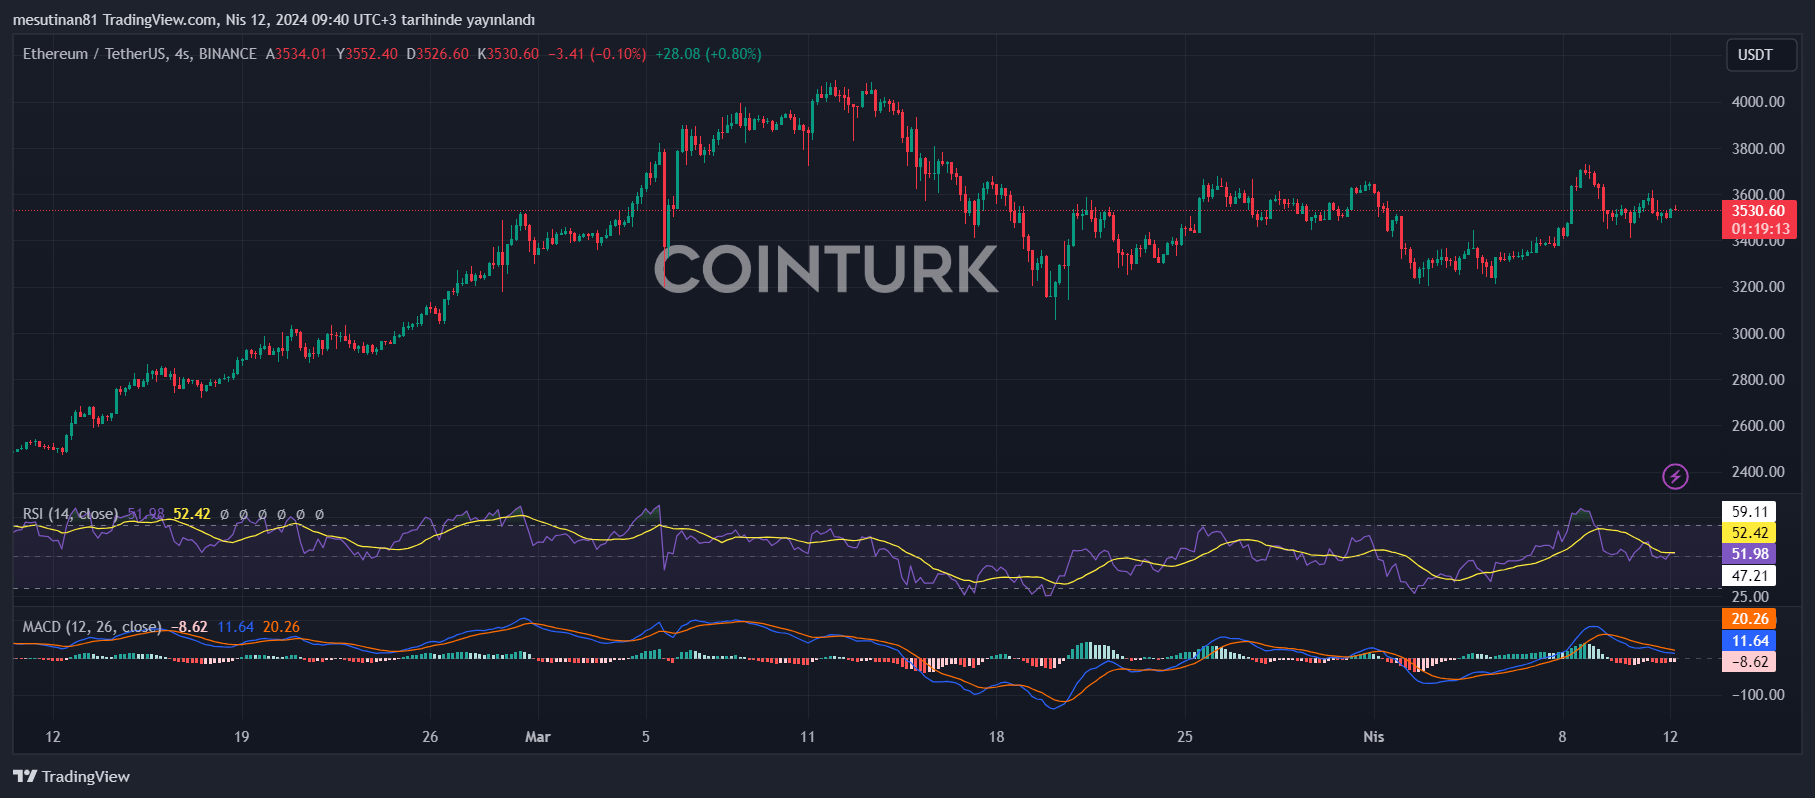
Ethereum is trading above $3,500. However, the immediate point of attention is overcoming resistance zones between $3,560 and $3,620. A notable aspect on the 4-hour chart of the ETH/USD pair is the emergence of a new connecting bearish trend line at the $3,550 resistance. This appears to be an important test for Ethereum.
Although Ethereum’s price has attempted to rise above the $3,550 resistance and even managed to climb above $3,600, these increases remained limited like those of Bitcoin. The price is seen to have climbed to $3,614 before cutting gains at these levels. However, it is recorded that the price then pulled back to $3,476.
Resistance Levels Crucial for ETH
Currently, Ethereum is trading above $3,500, but resistance levels should be closely monitored going forward. In particular, the $3,550 resistance and the levels corresponding to the 50% Fib retracement level of the recent decline are significant.
Looking at critical points, Ethereum needs to overcome the first major resistance level around $3,620. Then, the levels of $3,650 and even $3,720 could be tested. However, the key point seems to be surpassing the $3,750 level for Ethereum to gain momentum. In this case, the price could be expected to rise towards the $3,820 region and perhaps even observe a move to the $4,000 resistance.
If ETH Fails to Break Resistance
If Ethereum cannot surpass the $3,550 resistance, it could enter a downward trend once again. Currently, the first support level Ethereum could encounter if it moves downwards is around $3,500. However, a more pronounced decline could lead to a pullback towards the $3,475 zone.
A break below this level could drag ETH to the critical support region of $3,420. And if this support is also broken, it is anticipated that Ethereum could retreat to the $3,320 level. Of course, further losses could potentially lead to a journey towards the $3,240 level.
Ethereum’s Technical Indicators
Looking at technical indicators, the 4-hour MACD for ETH/USD is losing momentum in the bearish zone. However, the 4-hour RSI is currently above the 50 level. This could indicate that some buyers are still entering the market.
Regarding key levels, the main support level for ETH is currently around $3,475. On the other hand, the main resistance level is determined to be $3,550.