Ethereum (ETH)  $1,874 experienced a rapid recovery, rising over 20% after hitting a low of $2,620 at the beginning of November, and surpassed $3,000 by December 9. However, technical and on-chain indicators raise serious doubts about the sustainability of this rise. Experts highlight critical patterns suggesting an increased likelihood of a sharp correction for Ethereum in the coming months.
Tops and Patterns: Cup-and-Handle Phenomenon
Recently, Ethereum’s chart has shown the formation of an inverted cup-and-handle, a classic bearish structure. This pattern often concludes with a sharp break and significant price declines. The rounded top forming after ETH climbed to $4,100 in August, followed by falling below the 50-day and 200-day exponential moving averages, supports this structure.
The “handle” part of the pattern is visible as a rising channel. However, the price consistently failing to overcome the $3,150 resistance indicates waning buyer strength. Analysts suggest that should the price fall below $2,900, at the lower band of the channel, the decline would be confirmed, putting the target region of $1,500 back in focus.
Expected at the start of 2024, this target aligns with a strong support area. Thus, technically, the $1,500 level is not just a possibility but a strong scenario. Bulls need to reclaim the $3,300–$3,450 range to alleviate downward risks; otherwise, the risk remains tilted to the downside.
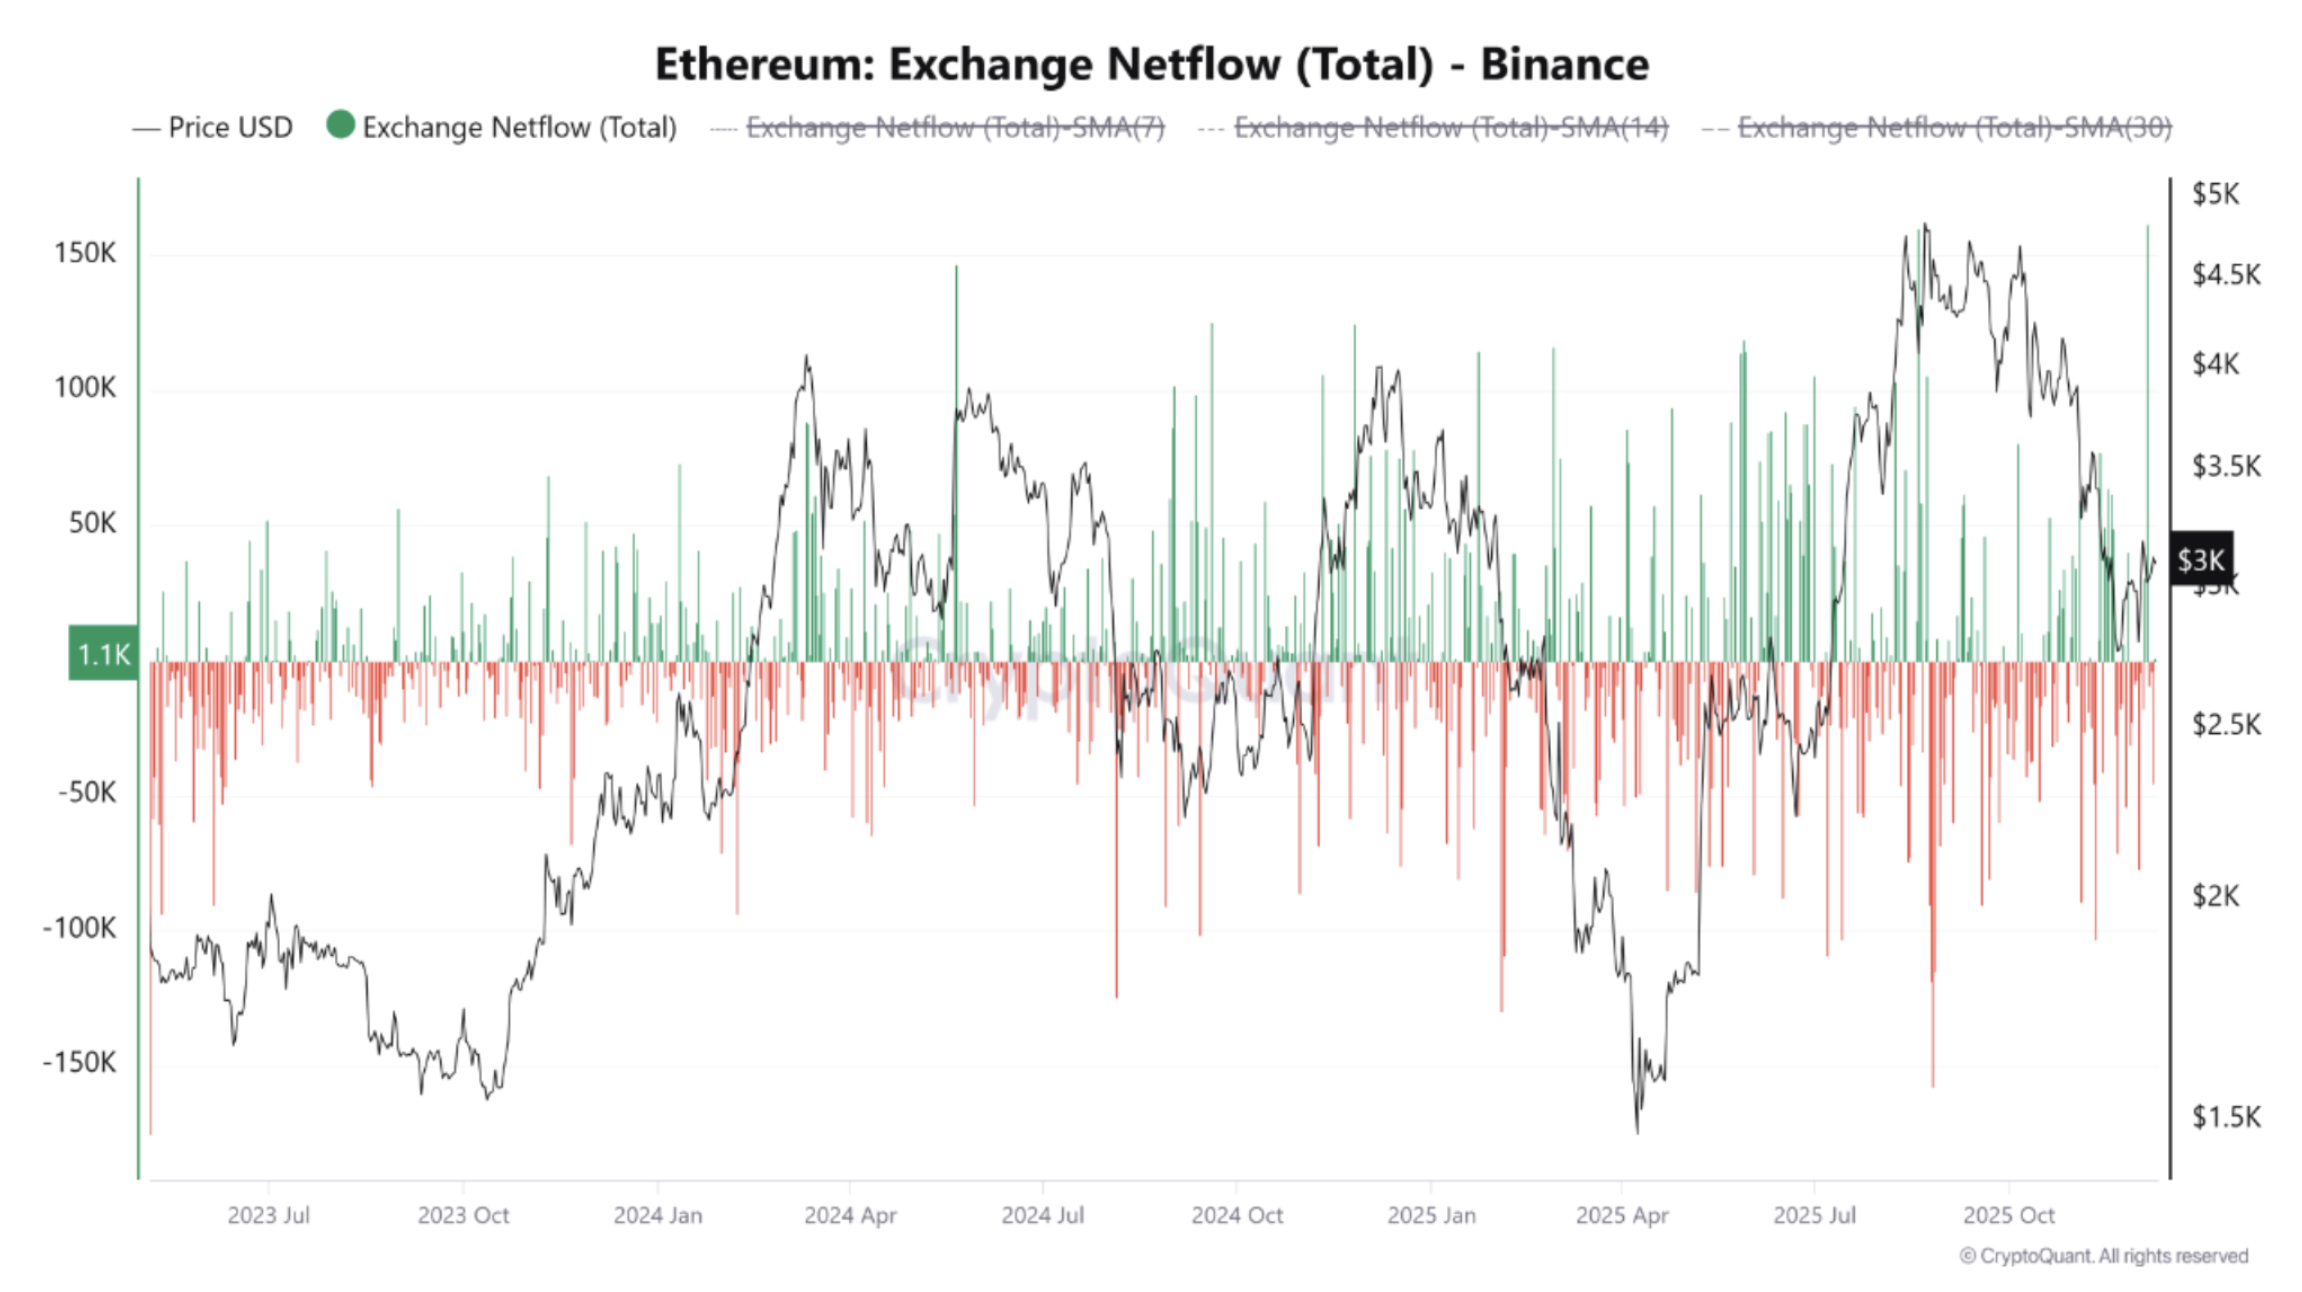
Massive Ethereum Inflows Put Pressure on Prices
The chart’s weaknesses are not limited to these. On-chain data also reveals developments strengthening sellers’ positions in the short term. The net inflow of 162,000 ETH into Binance on December 5 marked the largest movement since May 2023. CryptoOnChain analysts emphasize that these inflows signal large investors preparing to sell.
In the past, similar large-scale exchange inflows have typically resulted in periods of high volatility or severe price declines. Furthermore, ETH is currently trading below major moving averages, indicating its vulnerability to sharp losses if selling commences.
Another development in the crypto market adding complexity is the new meme coin trend and increased network activity in the Solana  $73 ecosystem. This shift in investor interest from Ethereum to alternative platforms also indirectly pressures Ethereum.
In conclusion, despite attempts at a rally, both technical and on-chain data point to a bearish outlook for Ethereum. Bulls must achieve strong volume closures above $3,300 to regain control. Otherwise, a potential drop below $2,900 could trigger panic selling, leading to a sharp dive towards $1,500.