In the cryptocurrency market, a renewed sense of optimism has begun with the decrease in Grayscale’s Bitcoin sales. The recent surge in the altcoin market is helping investors to recover from losses experienced in the past weeks. So, how has the altcoin king Ethereum fared during this period? At the time of writing, Ethereum is trading at $2279. What do the chart analyses indicate? Let’s take a look together.
Ethereum Chart Analysis
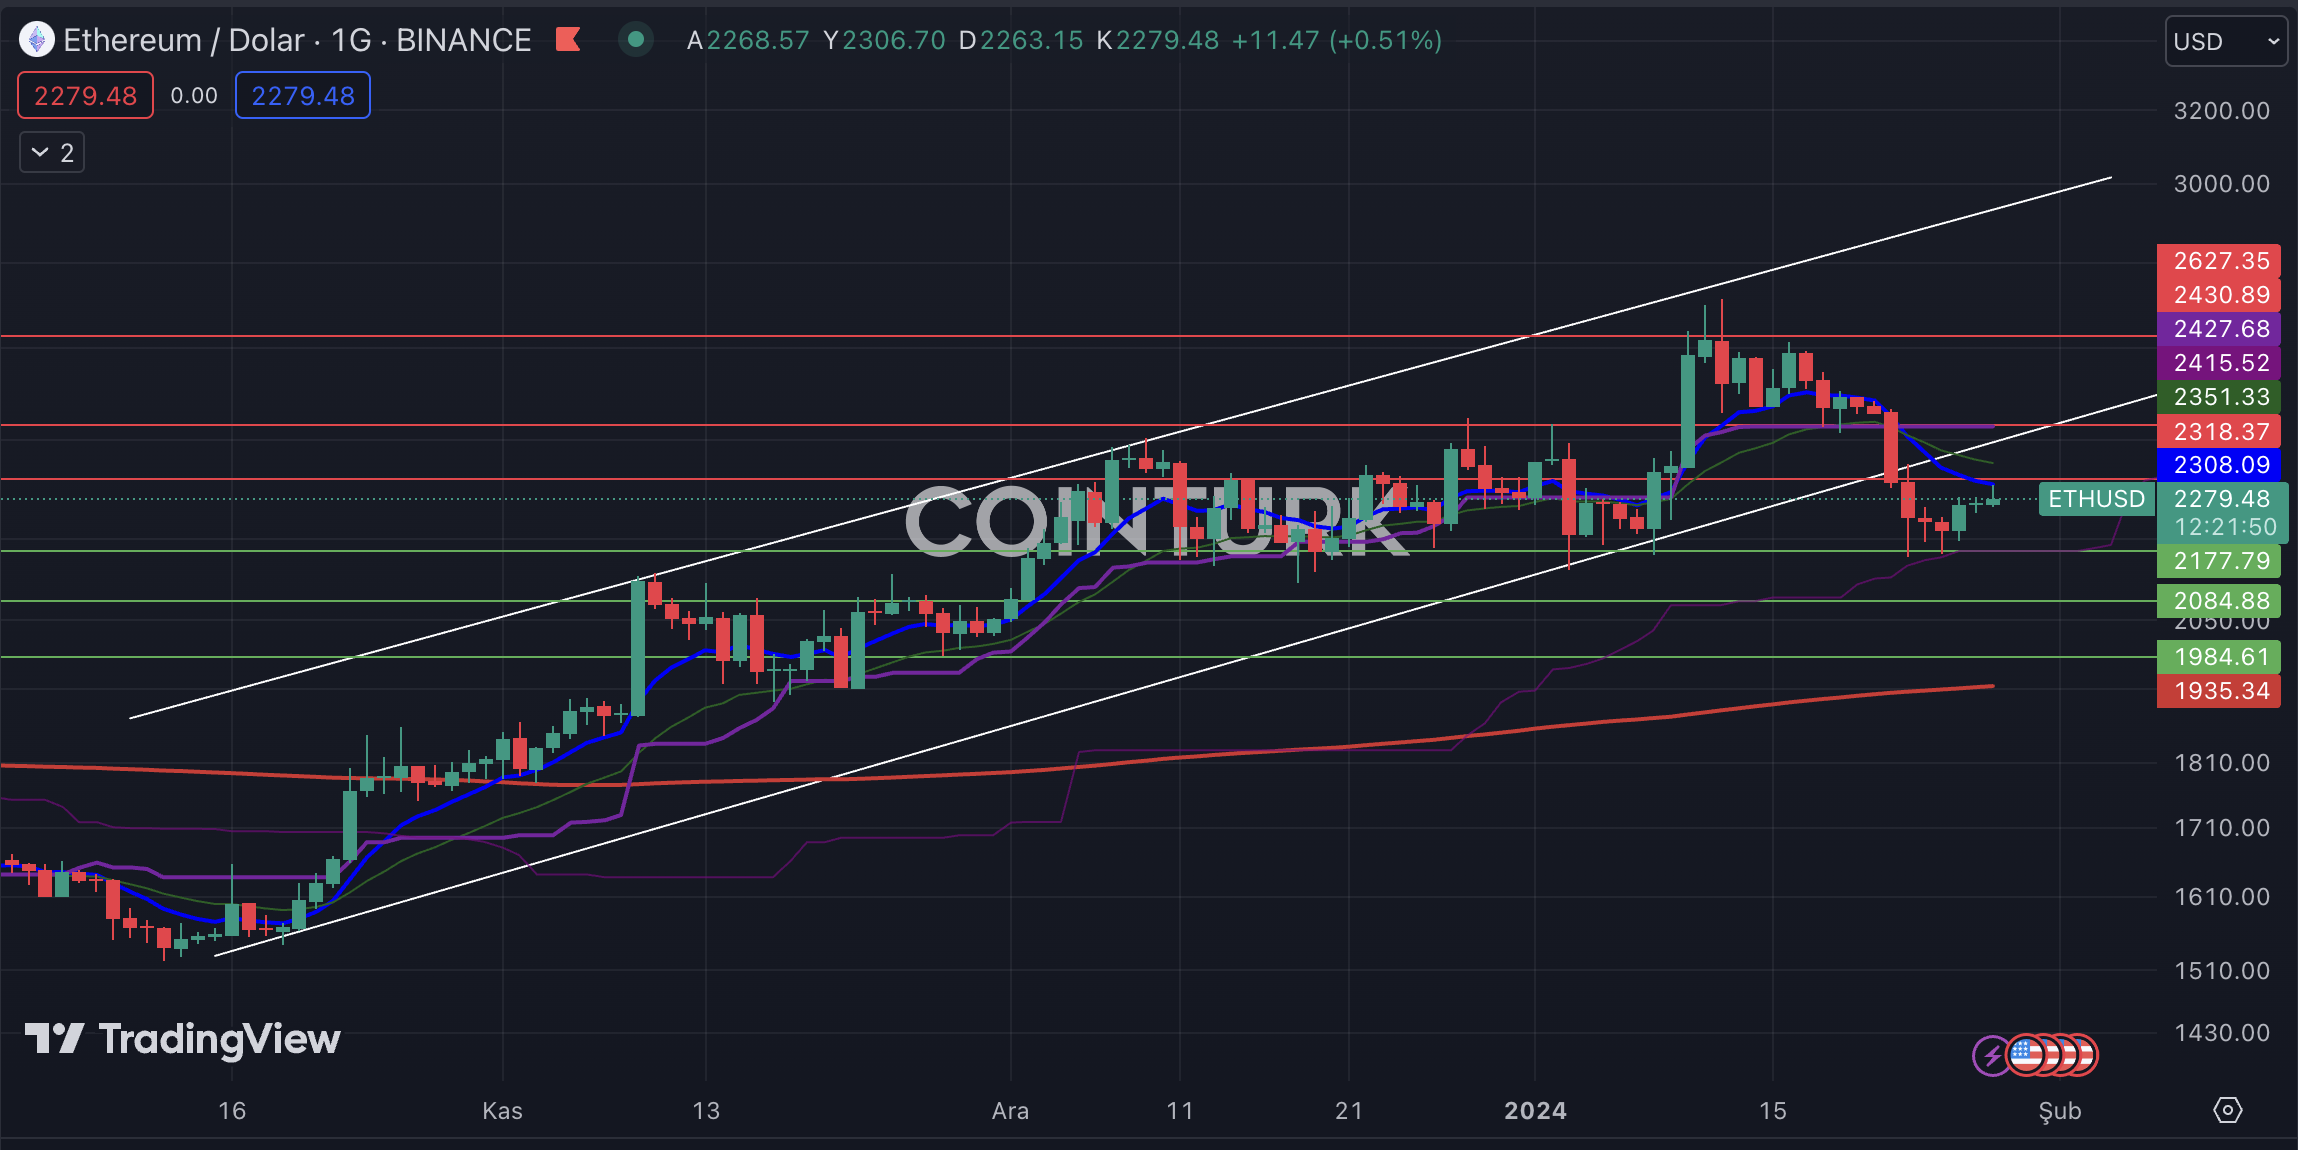
The daily Ethereum chart was notable for its ascending channel formation structure. This structure provided significant clues to many investors, but with the recent decline, ETH began trading below the formation’s support line. Additionally, the EMA 21 (blue line) acting as resistance during the last upward movement opens up the possibility of a short-term negative scenario for Ethereum.
The most important support levels to watch on the daily Ethereum chart are; $2177 / $2084 and $1984, respectively. Particularly, a daily bar closure below the crucial $2177 level could expose the Ethereum price to selling pressure.
The most important resistance levels to watch on the daily Ethereum chart are; $2318 / $2430 and $2627, respectively. Especially, a daily bar closure above the $2318 level, which intersects with the EMA 21, would help Ethereum’s price to gain momentum.

ETH/BTC Chart Analysis
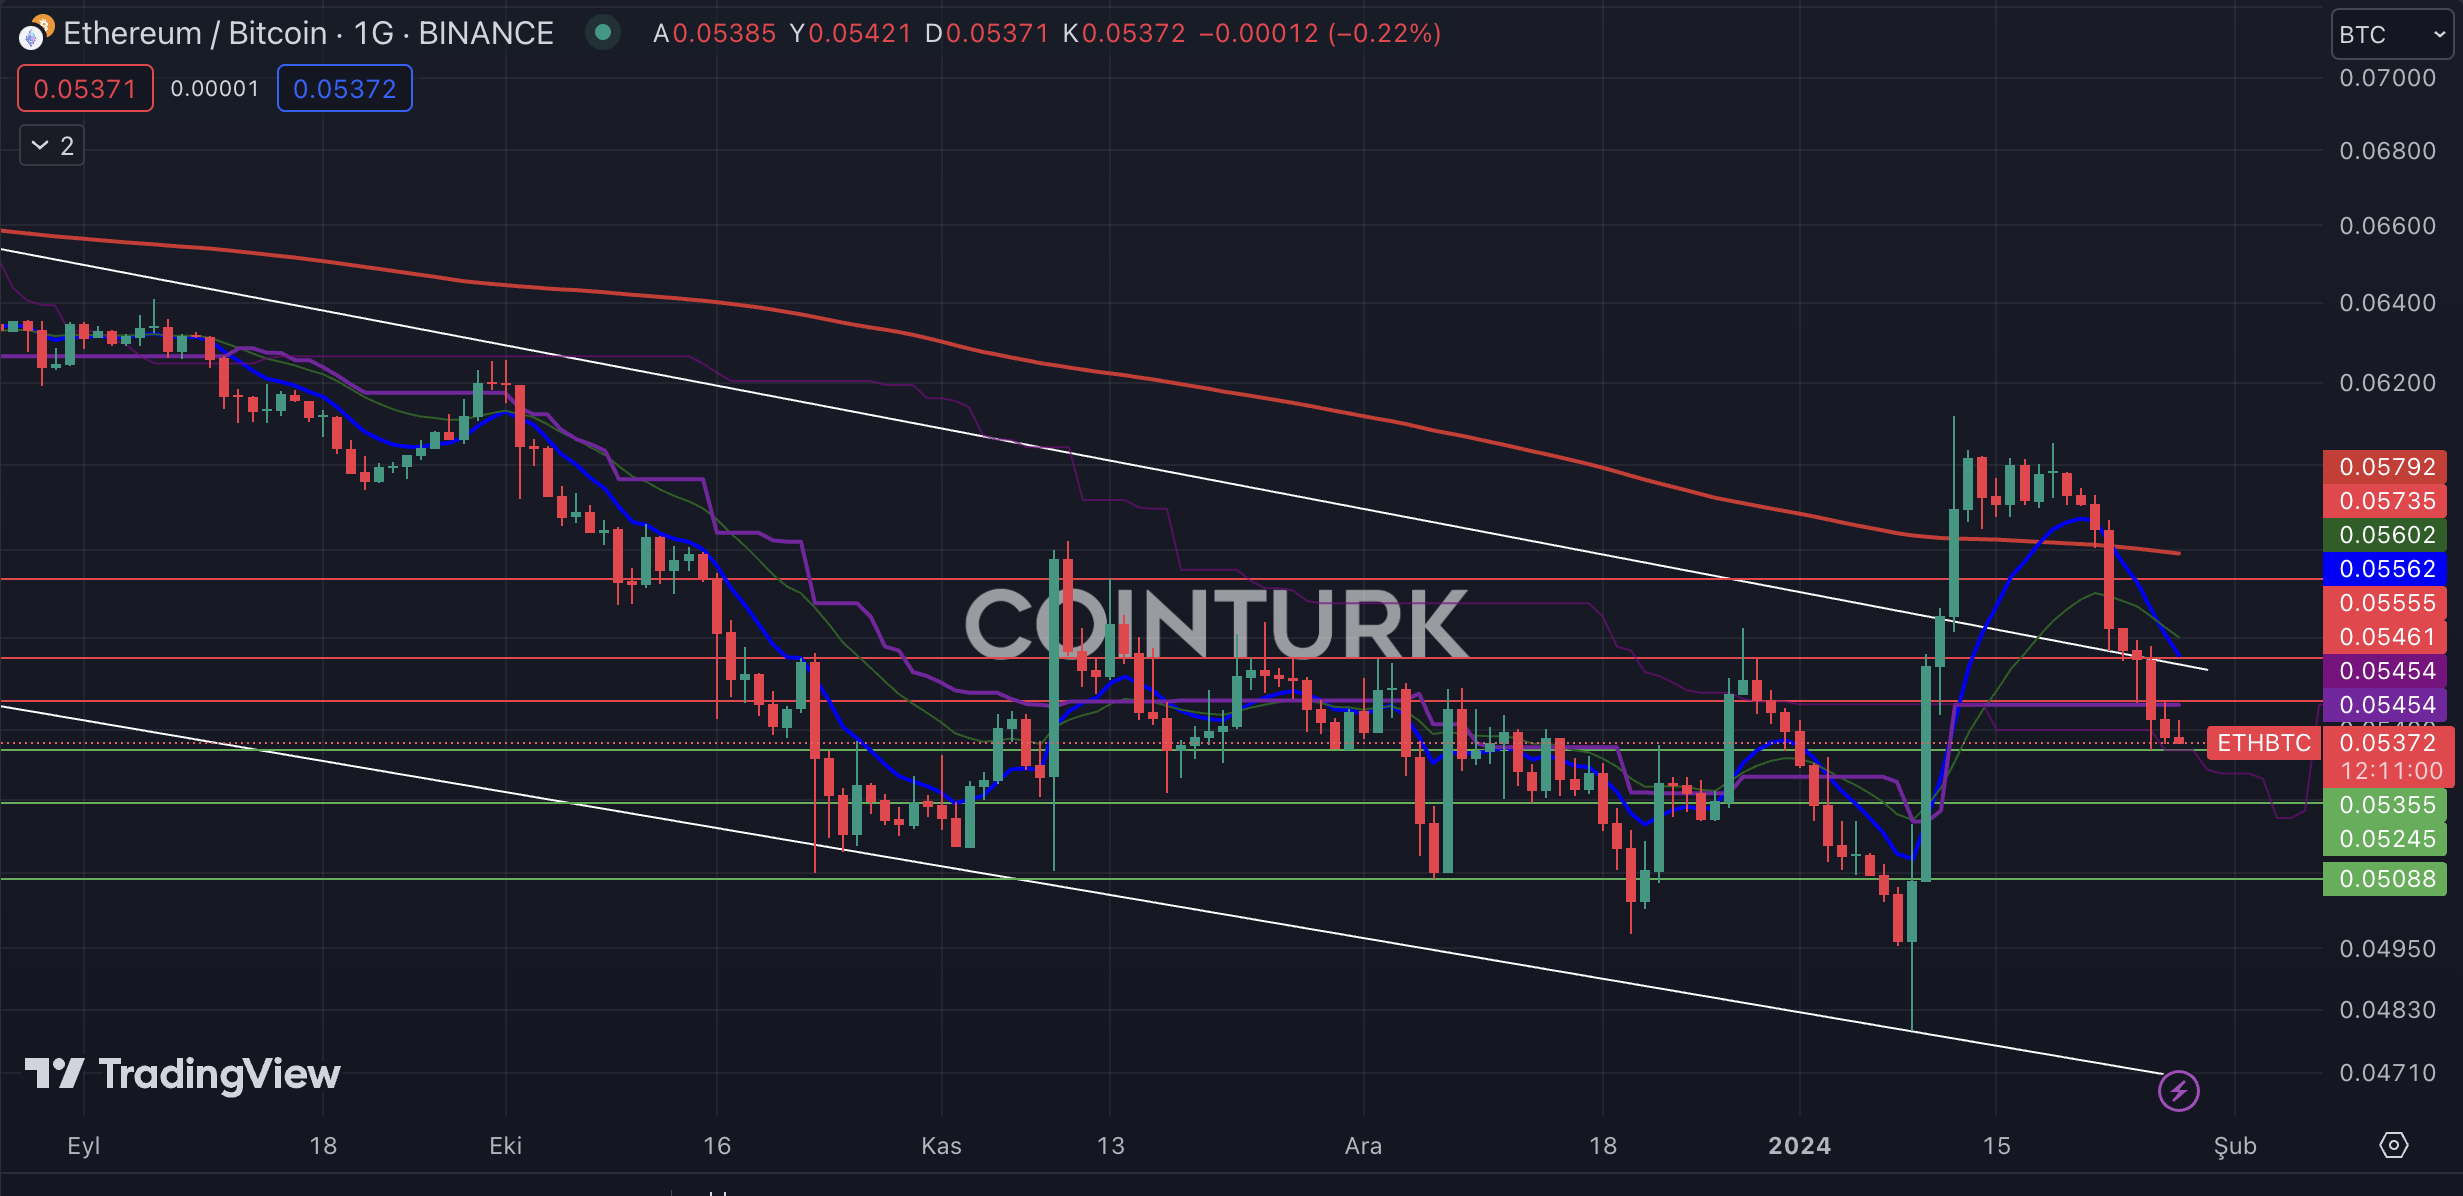
In the ETH/BTC chart, Ethereum experienced a rise following spot ETF news, breaking the resistance of the falling channel formation. However, with the SEC’s postponement of the ETF application, Ethereum faced a sell-off, and the ETH/BTC ratio returned to the formation zone. During this period, Ethereum lost value while Bitcoin gained.
The most important support levels to follow on the daily ETH/BTC chart are; 0.05355 / 0.05245 and 0.05088, respectively. A daily bar closure below the significant support level of 0.05355 could lead to Ethereum losing value against Bitcoin.
The most important resistance levels to watch in the ETH/BTC chart are; 0.05461 / 0.05555 and 0.05735, respectively. Particularly, a daily bar closure above the 0.05555 level, which coincides with the formation resistance, would enable Ethereum to gain value against Bitcoin.


