After the long-awaited spot Bitcoin ETF applications were approved by the SEC, different excitements began to emerge in the crypto market. Accordingly, possible spot ETF processes for Ethereum helped ETH’s price to gain momentum, but with the recent developments, this excitement gave way to selling pressure. So, what is expected for Ethereum in the upcoming period? Let’s examine together.
Ethereum Chart Analysis
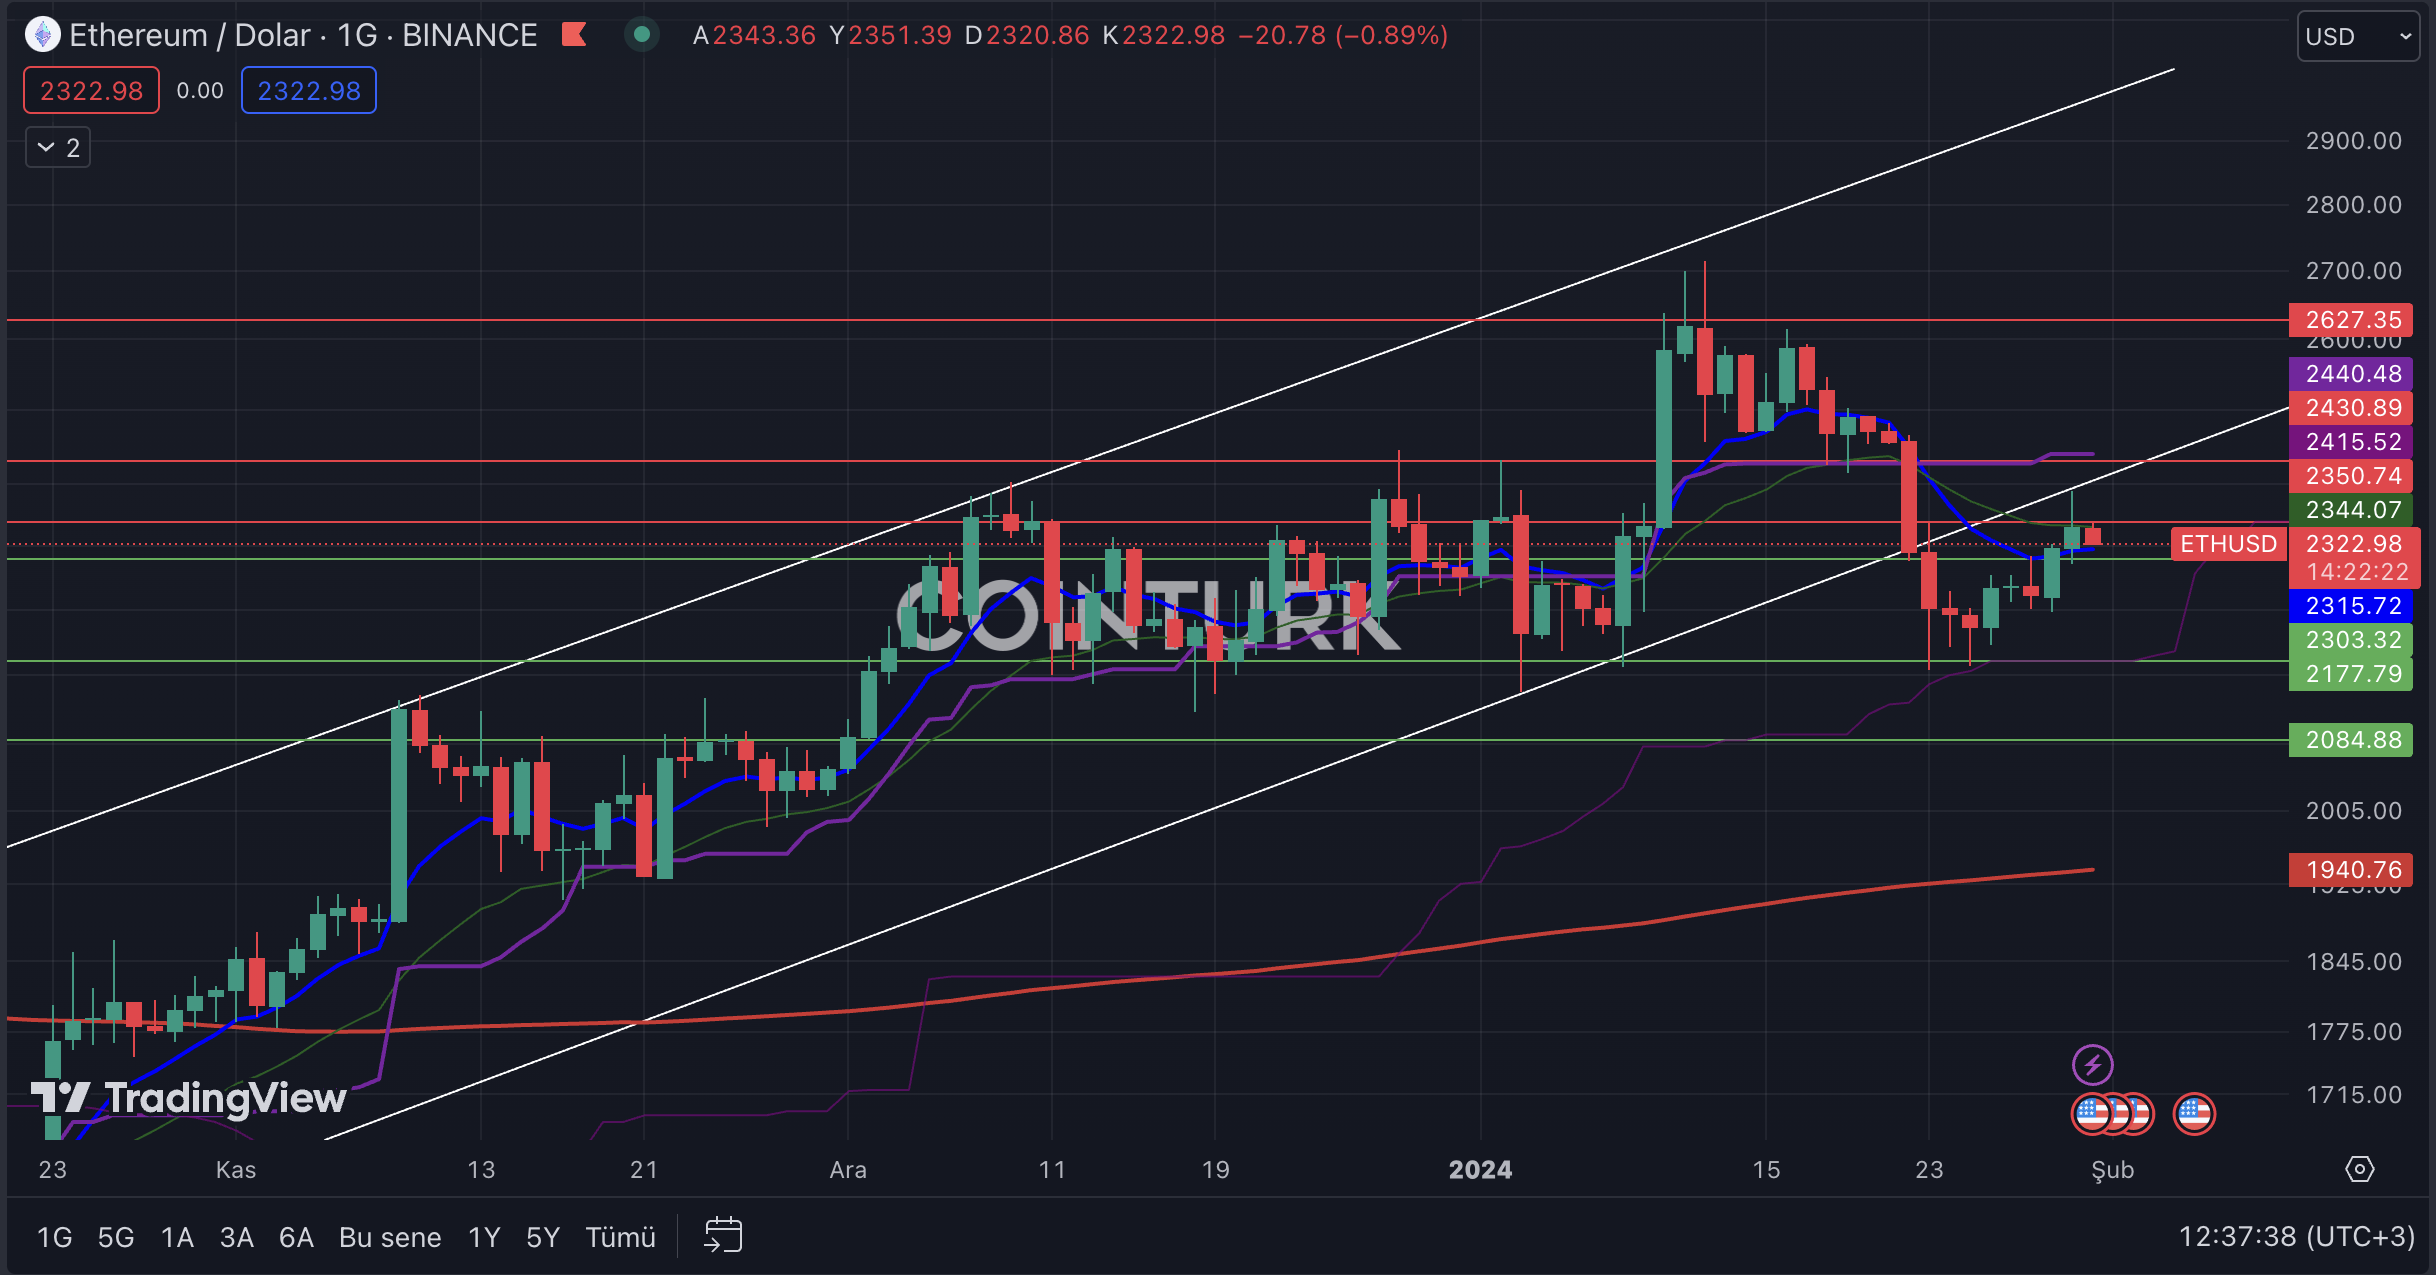
With the rising momentum that began in October, the ascending channel formation structure in the daily Ethereum chart managed to attract attention. Until the last week in this structure, the absence of any support or resistance break provided important clues for investors. However, the recent break of support led to selling pressure on Ethereum, causing concerns to increase as the formation’s support line began to act as resistance in the latest bar formations.
The most important support levels to follow on the daily chart for Ethereum are, in order; 2303 / 2177, and 2084 dollars. Especially, a daily bar close below the 2303 dollar level, which intersects with the EMA 21 (blue line), will cause Ethereum’s price to lose momentum in the short term.
The most important resistance levels to watch on the daily chart for Ethereum are, in order; 2350 / 2430, and 2627 dollars. Particularly, a daily bar close above the 2350 dollar level, which has been a significant obstacle in the last bar formation, will enable Ethereum’s price to gain momentum.

ETH/BTC Chart Analysis
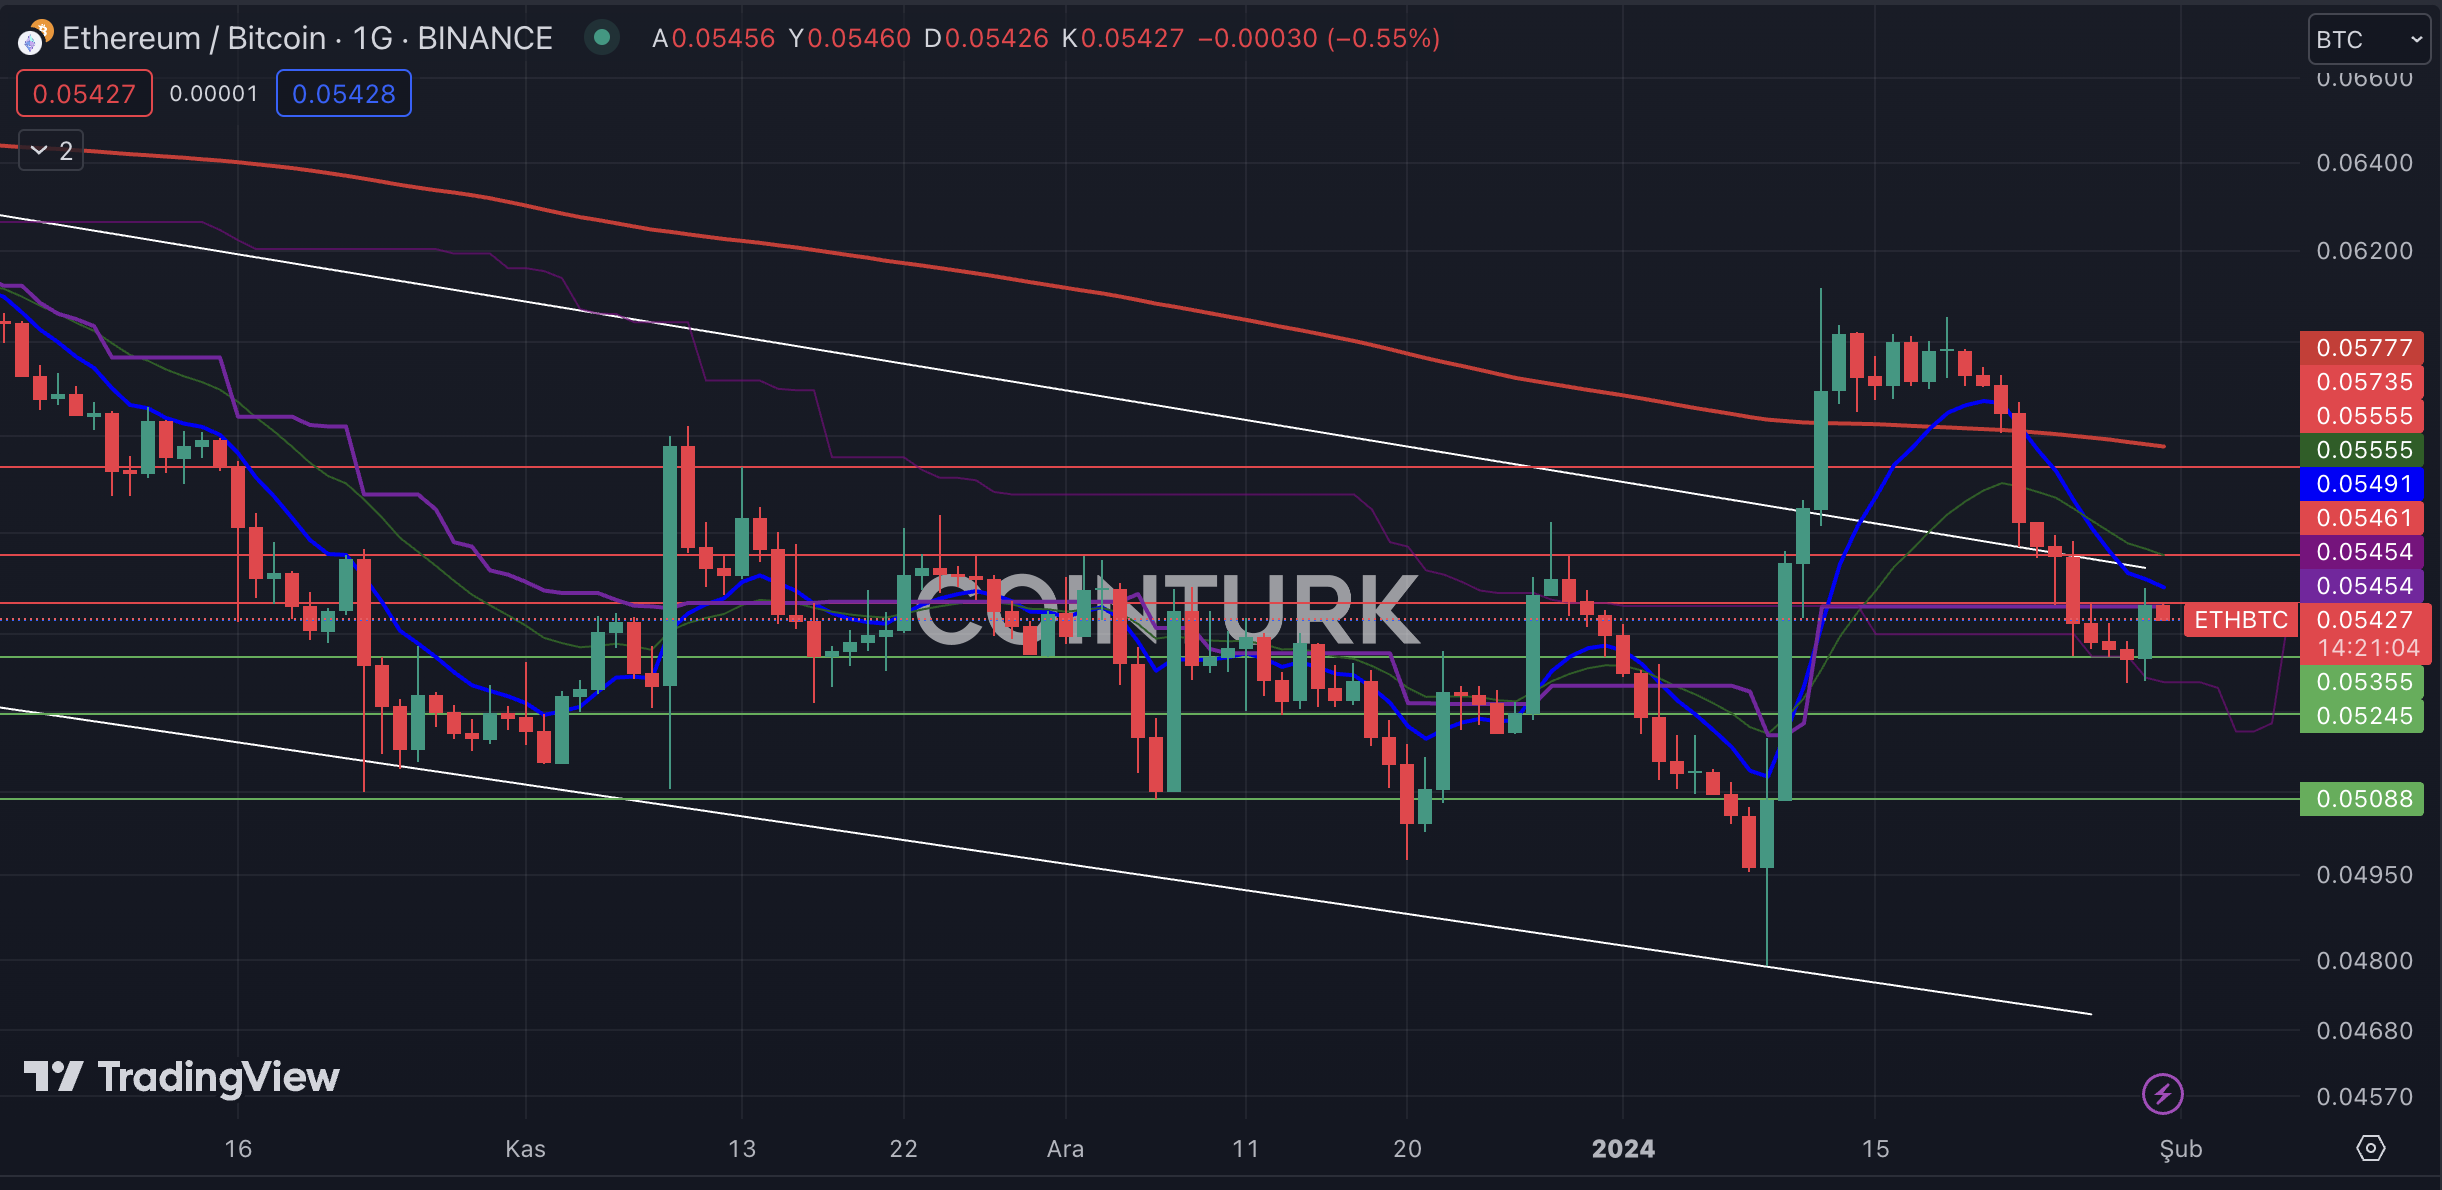
In the daily ETH/BTC chart, the falling channel formation gained momentum after the recent developments, but it continues to trade within the formation region due to the SEC’s decision to delay ETF applications.
The most important support levels to follow on the ETH/BTC chart are, in order; 0.05355 / 0.05245, and 0.05088. Particularly, a daily bar close below the 0.05355 level, which has played an important role in the latest bar formations, will cause Ethereum to lose value against Bitcoin.
The most important resistance levels to watch on the ETH/BTC chart are, in order; 0.05461 / 0.05555, and 0.05735. Especially, a daily bar close above the 0.05555 level, which intersects with the formation’s resistance line, will enable Ethereum to gain value against Bitcoin.


 Türkçe
 Español


