Ethereum‘s price is having difficulty reaching new peaks after a sustained period of increase. Despite this, analysts have noted several support levels that could prevent the so-called king of altcoins from falling further. So, what is expected in the coming period for Ethereum, which is trading at $2,241 at the time of writing? Let’s examine together.
Ethereum Chart Analysis
On the daily chart, Ethereum has continued its rise since it broke above the 200-day moving average and a broad descending channel. While trading above the $2,000 level, Ethereum is undergoing a consolidation phase below the $2,400 level and has not yet surpassed these levels.
The Relative Strength Index is also hovering around the 50 level at the time of writing, indicating a balance in momentum. In short, the short-term price movement largely depends on whether the king of altcoins falls below the $2,000 level or successfully breaks above the $2,400 level to target the $2,700 resistance zone.

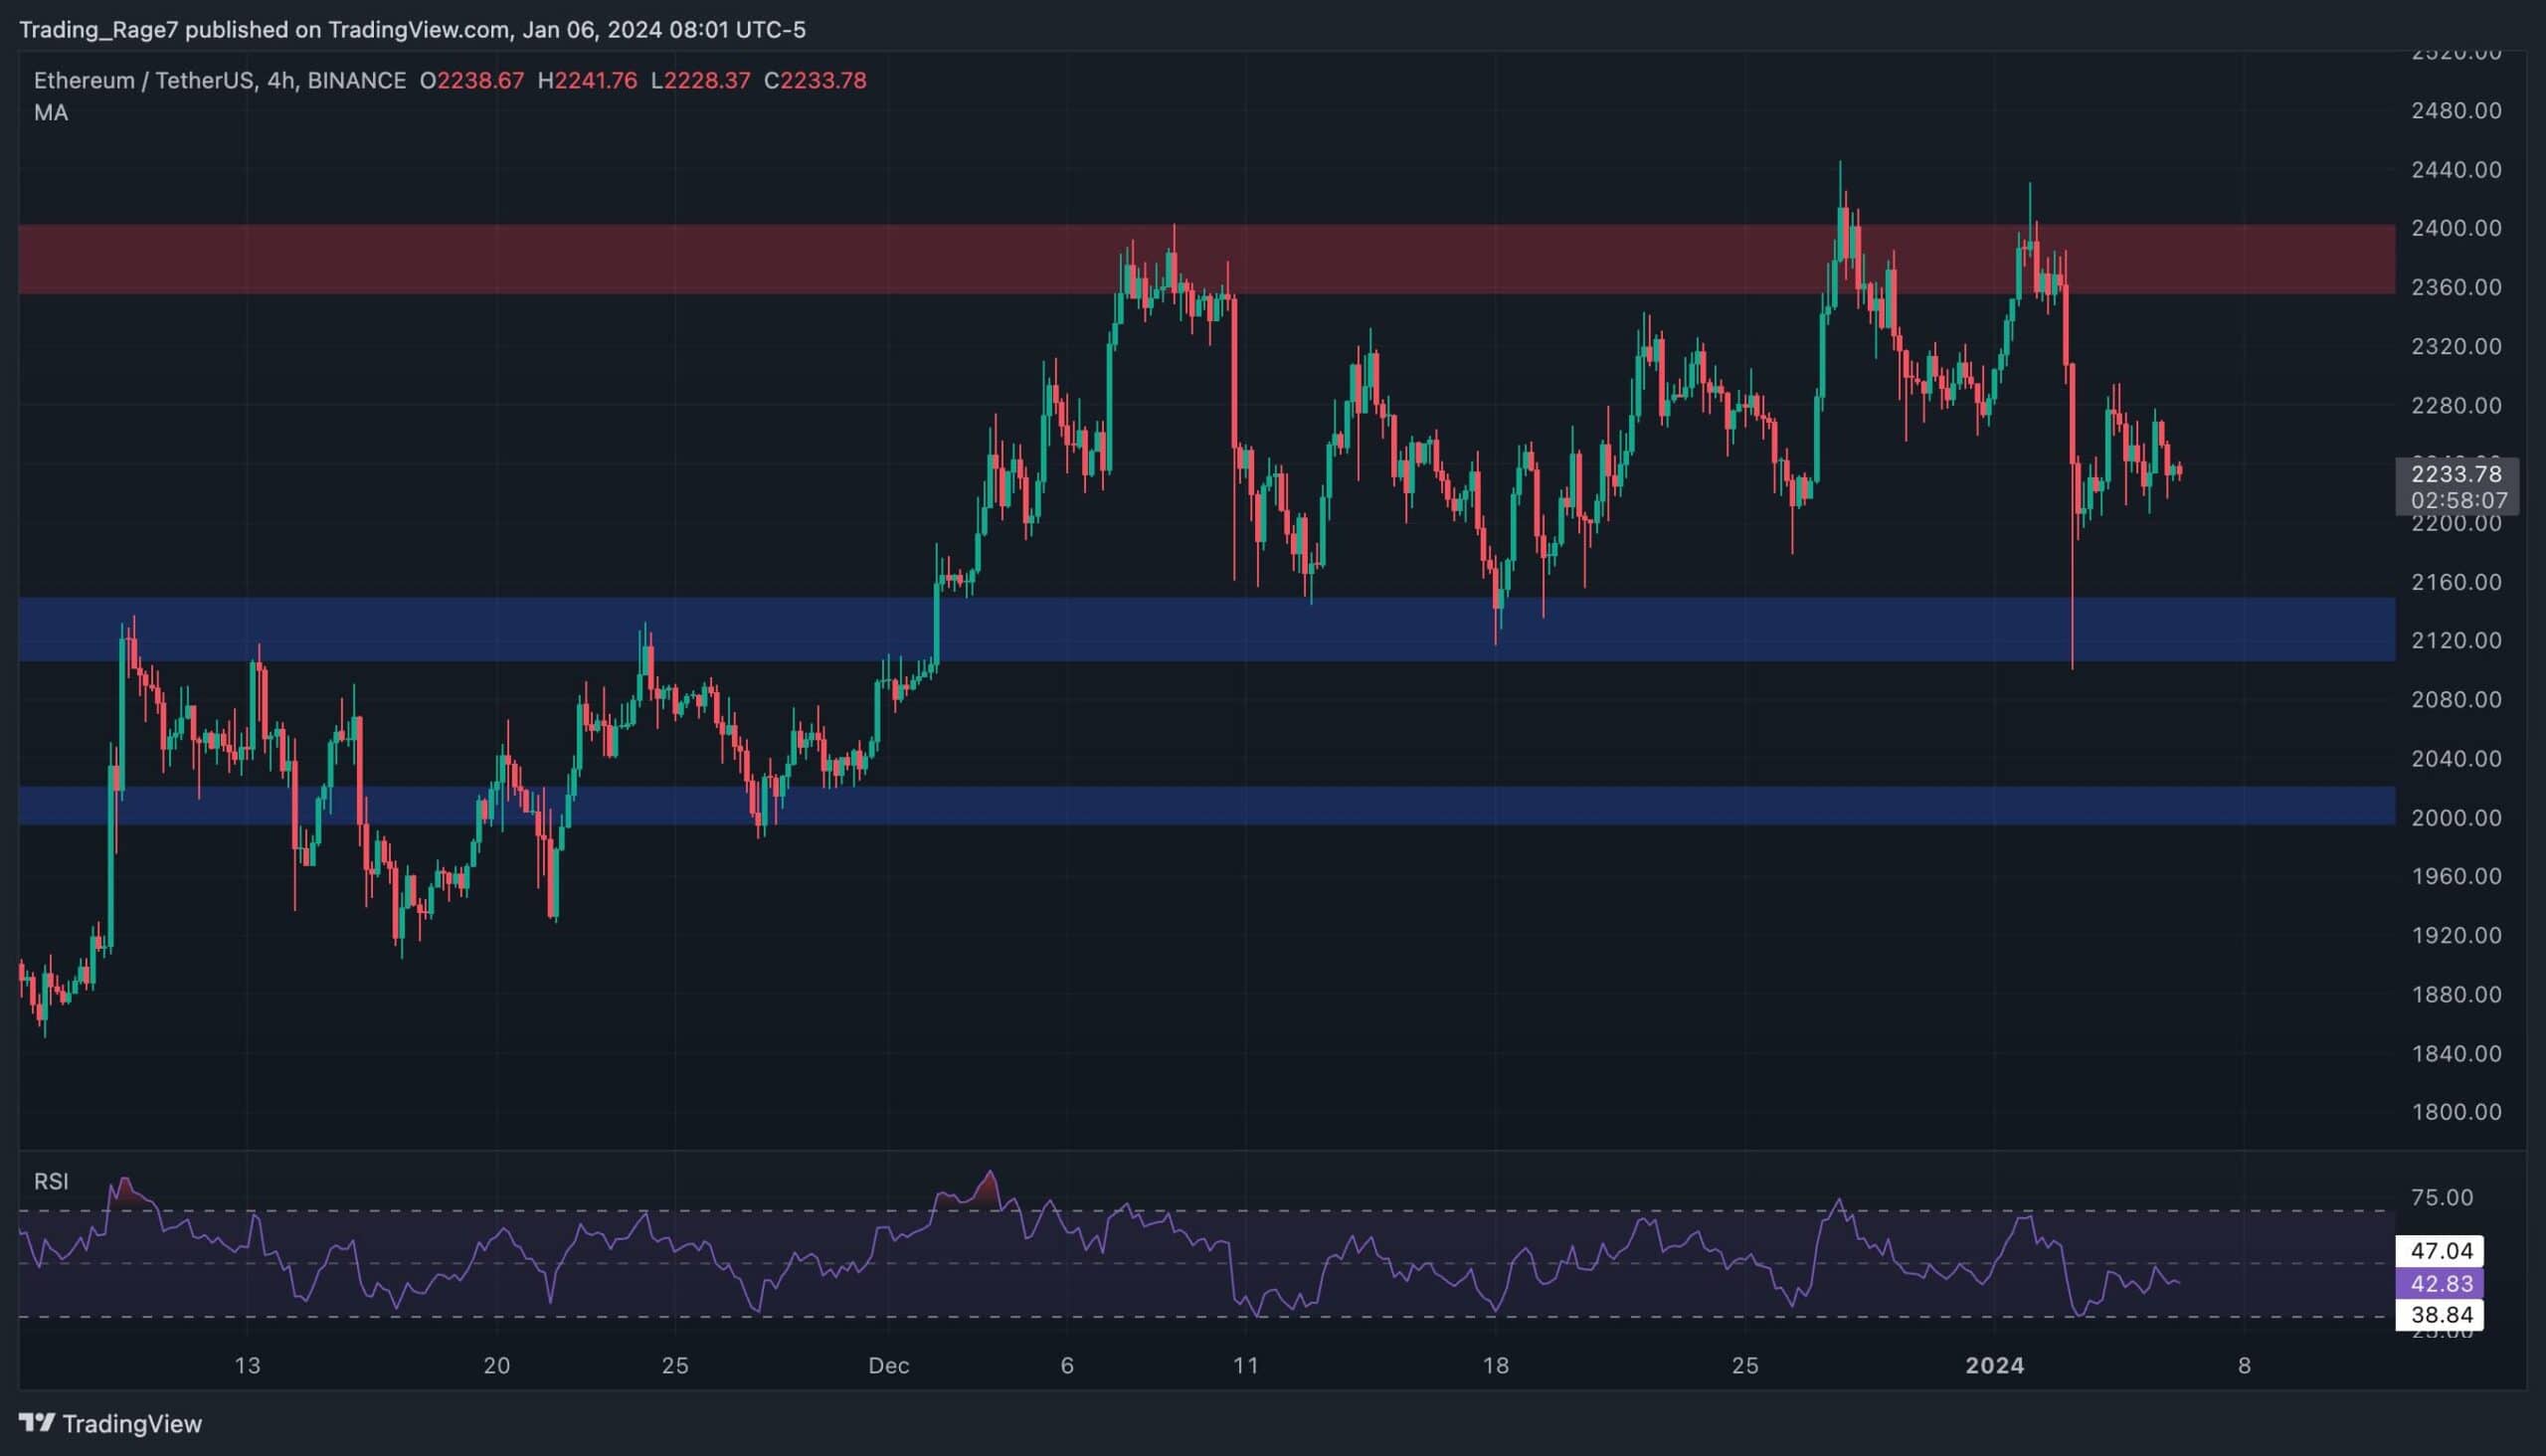
Looking at the 4-hour chart, it is noticeable that the price has been fluctuating between $2,100 and $2,400 levels over the past month. Following a recent sharp decline towards the old region, Ethereum’s price has seen a recovery and continues to consolidate in this area.

Noteworthy Data on Ethereum
Ethereum has entered a significant uptrend in recent months, rising from below $1,000 to above $2,400. Currently, the price exhibits uncertainty about its future trajectory, prompting a closer look at futures market sentiment for related data.
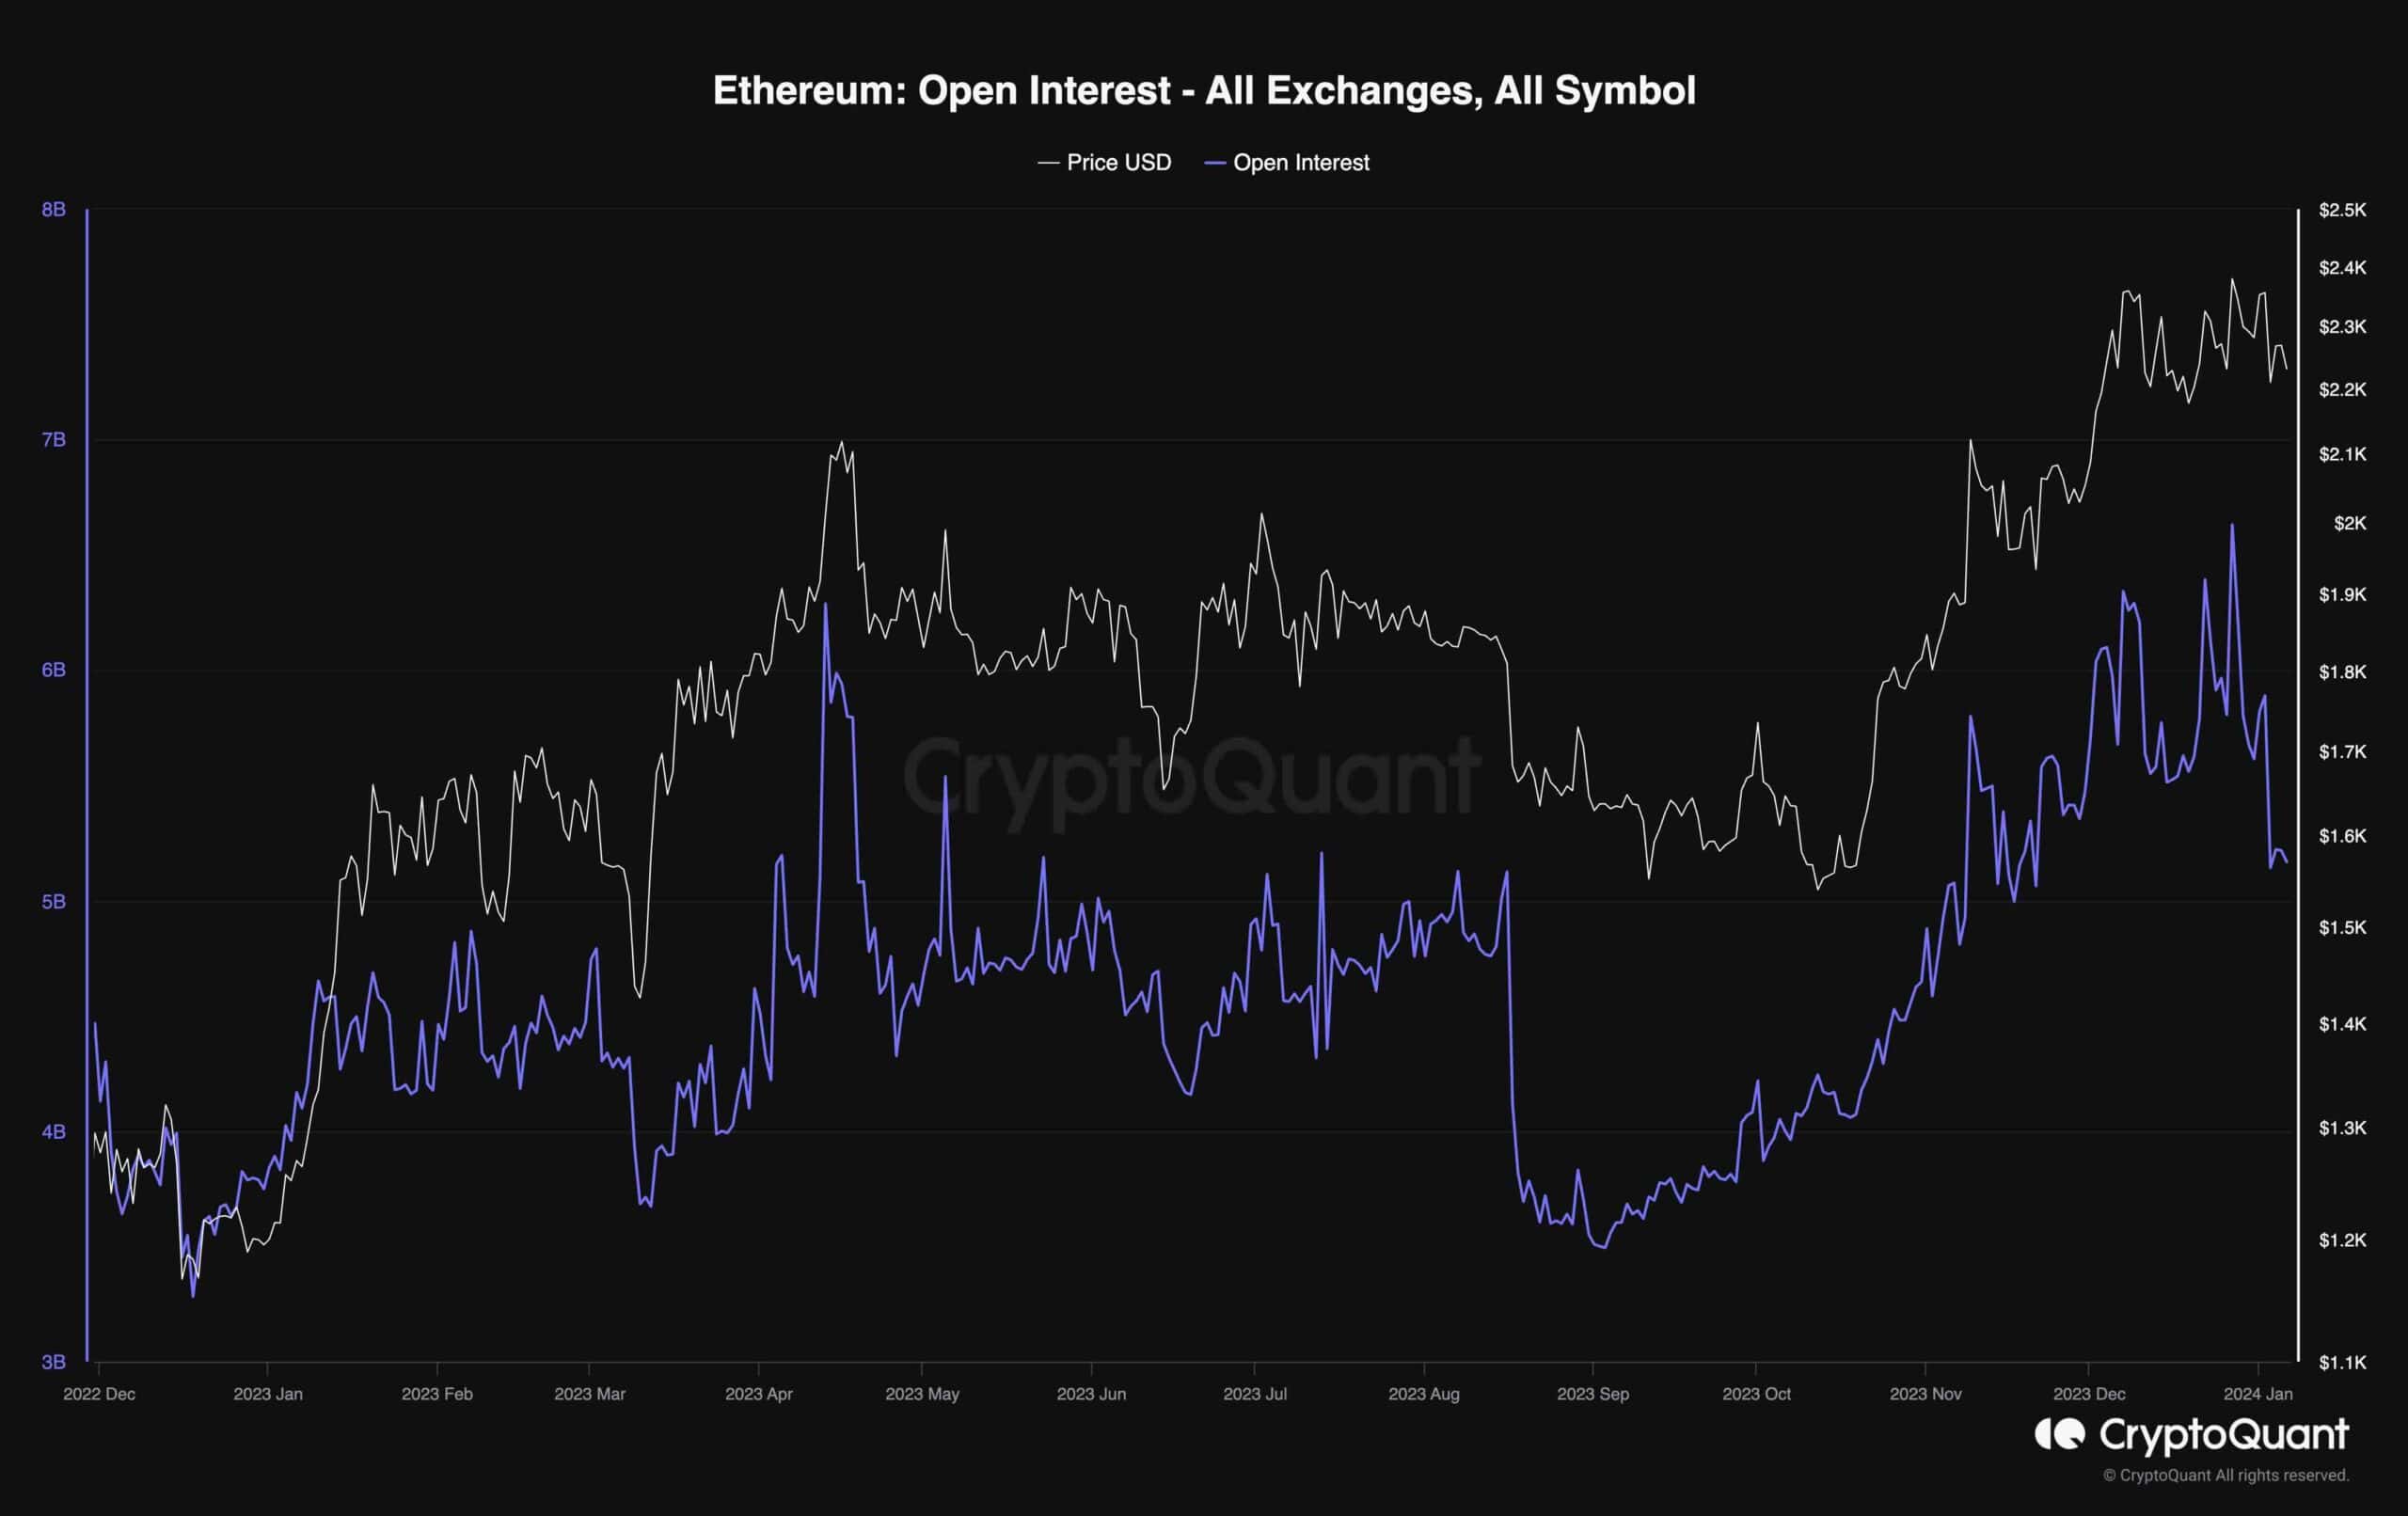
The provided graph shows the open interest data across all exchanges by counting the number of open futures contracts regardless of trade direction. Higher values indicate confidence in the trend among futures traders, while lower values point to uncertainty. Additionally, increasing open interest is associated with rising price volatility and a higher likelihood of liquidation tiers.
While the price was in an uptrend, open positions continuously increased, indicating a bullish market sentiment. However, the recent horizontal consolidation phase coincided with a significant decrease in open positions. This situation could indicate that many long positions have been cleared, pointing to a healthy futures market and potentially paving the way for a new trend. However, the direction of the upcoming trend remains uncertain until there is a significant move above or below one in the funding rate data.


