Ethereum, the most popular crypto asset of recent times, continues to gain the interest of crypto investors. Especially after the process of the spot Bitcoin ETF, Ethereum, which has become the focus of many claims, continues to be priced for a possible spot ETF process. So, what are the possible scenarios for Ethereum, which has risen 2.38% in the last 24 hours and is trading at $2530 at the time of writing? Let’s examine together.
Ethereum Four-Hour Chart Analysis
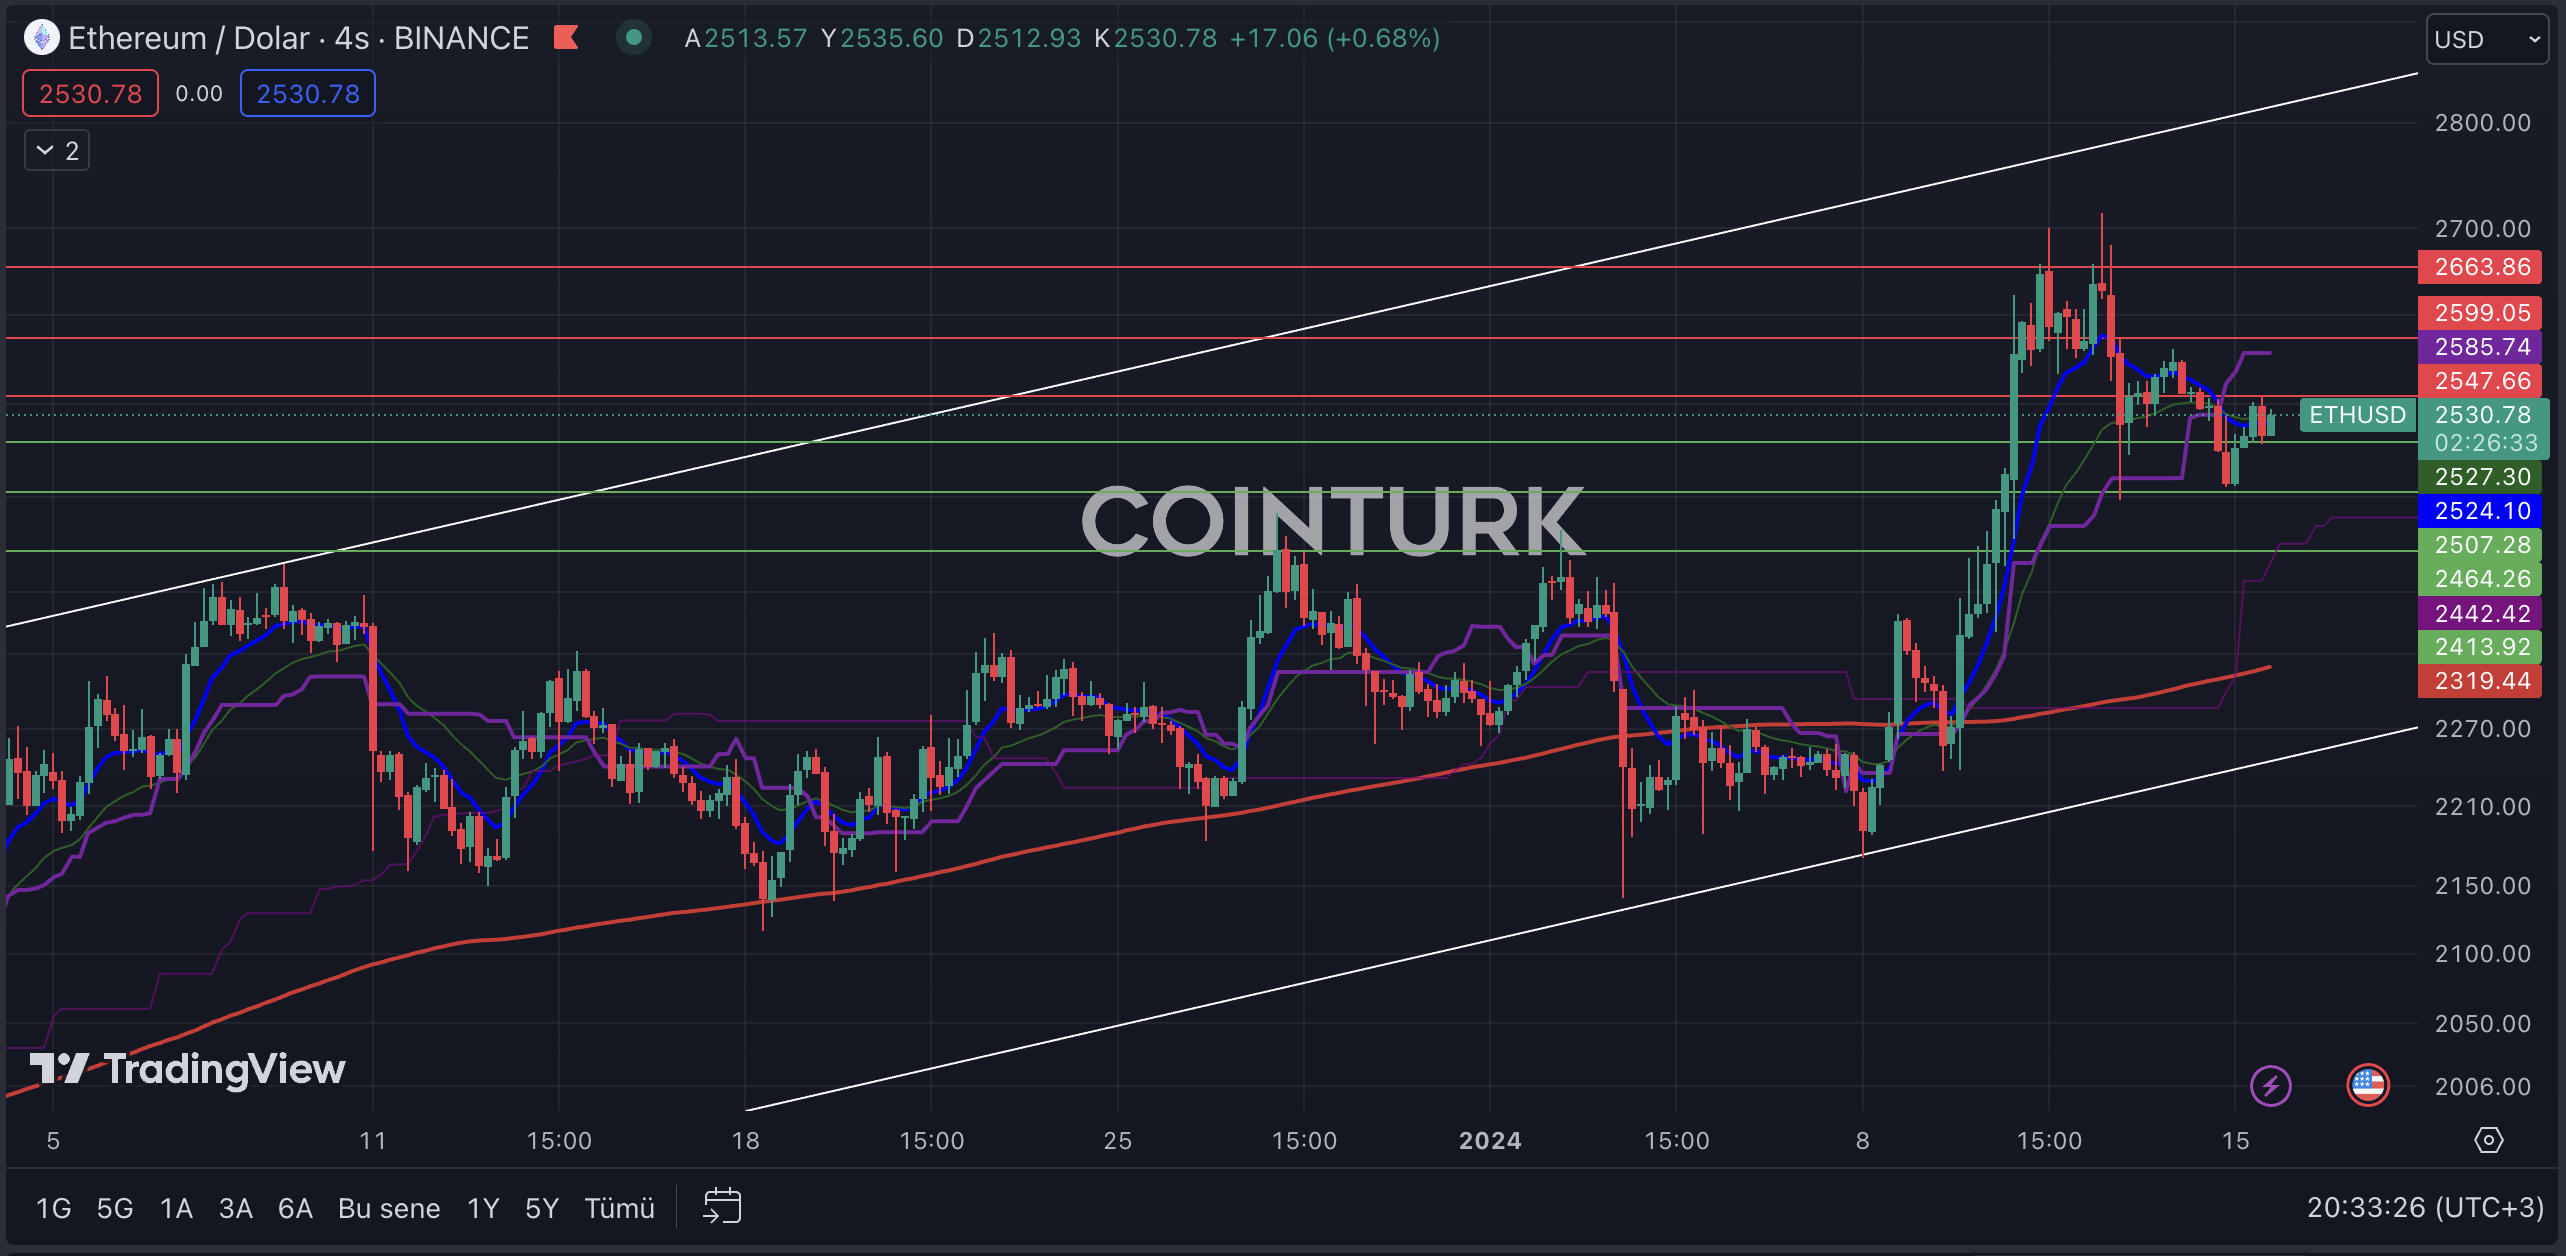
The four-hour Ethereum chart highlights an ascending channel formation. The fact that there has been no support or resistance breakout in this formation provides important clues to many investors. The EMA 21 (blue line) acting as support in the recent bar formations is a positive indicator for Ethereum in the short term.
The most important support levels to watch on the four-hour chart for Ethereum are, respectively; $2507 / $2464 and $2413. Particularly, a four-hour bar close below the $2507 level, which plays an important role in recent bar formations, could lead to selling pressure on the Ethereum price.
The most important resistance levels to watch on the four-hour chart for Ethereum are, respectively; $2547 / $2599 and $2663. Especially, a four-hour bar close above the $2547 level, which appears as a major obstacle in recent bar formations, will facilitate an increase in the Ethereum price.

Ethereum Weekly Chart Analysis
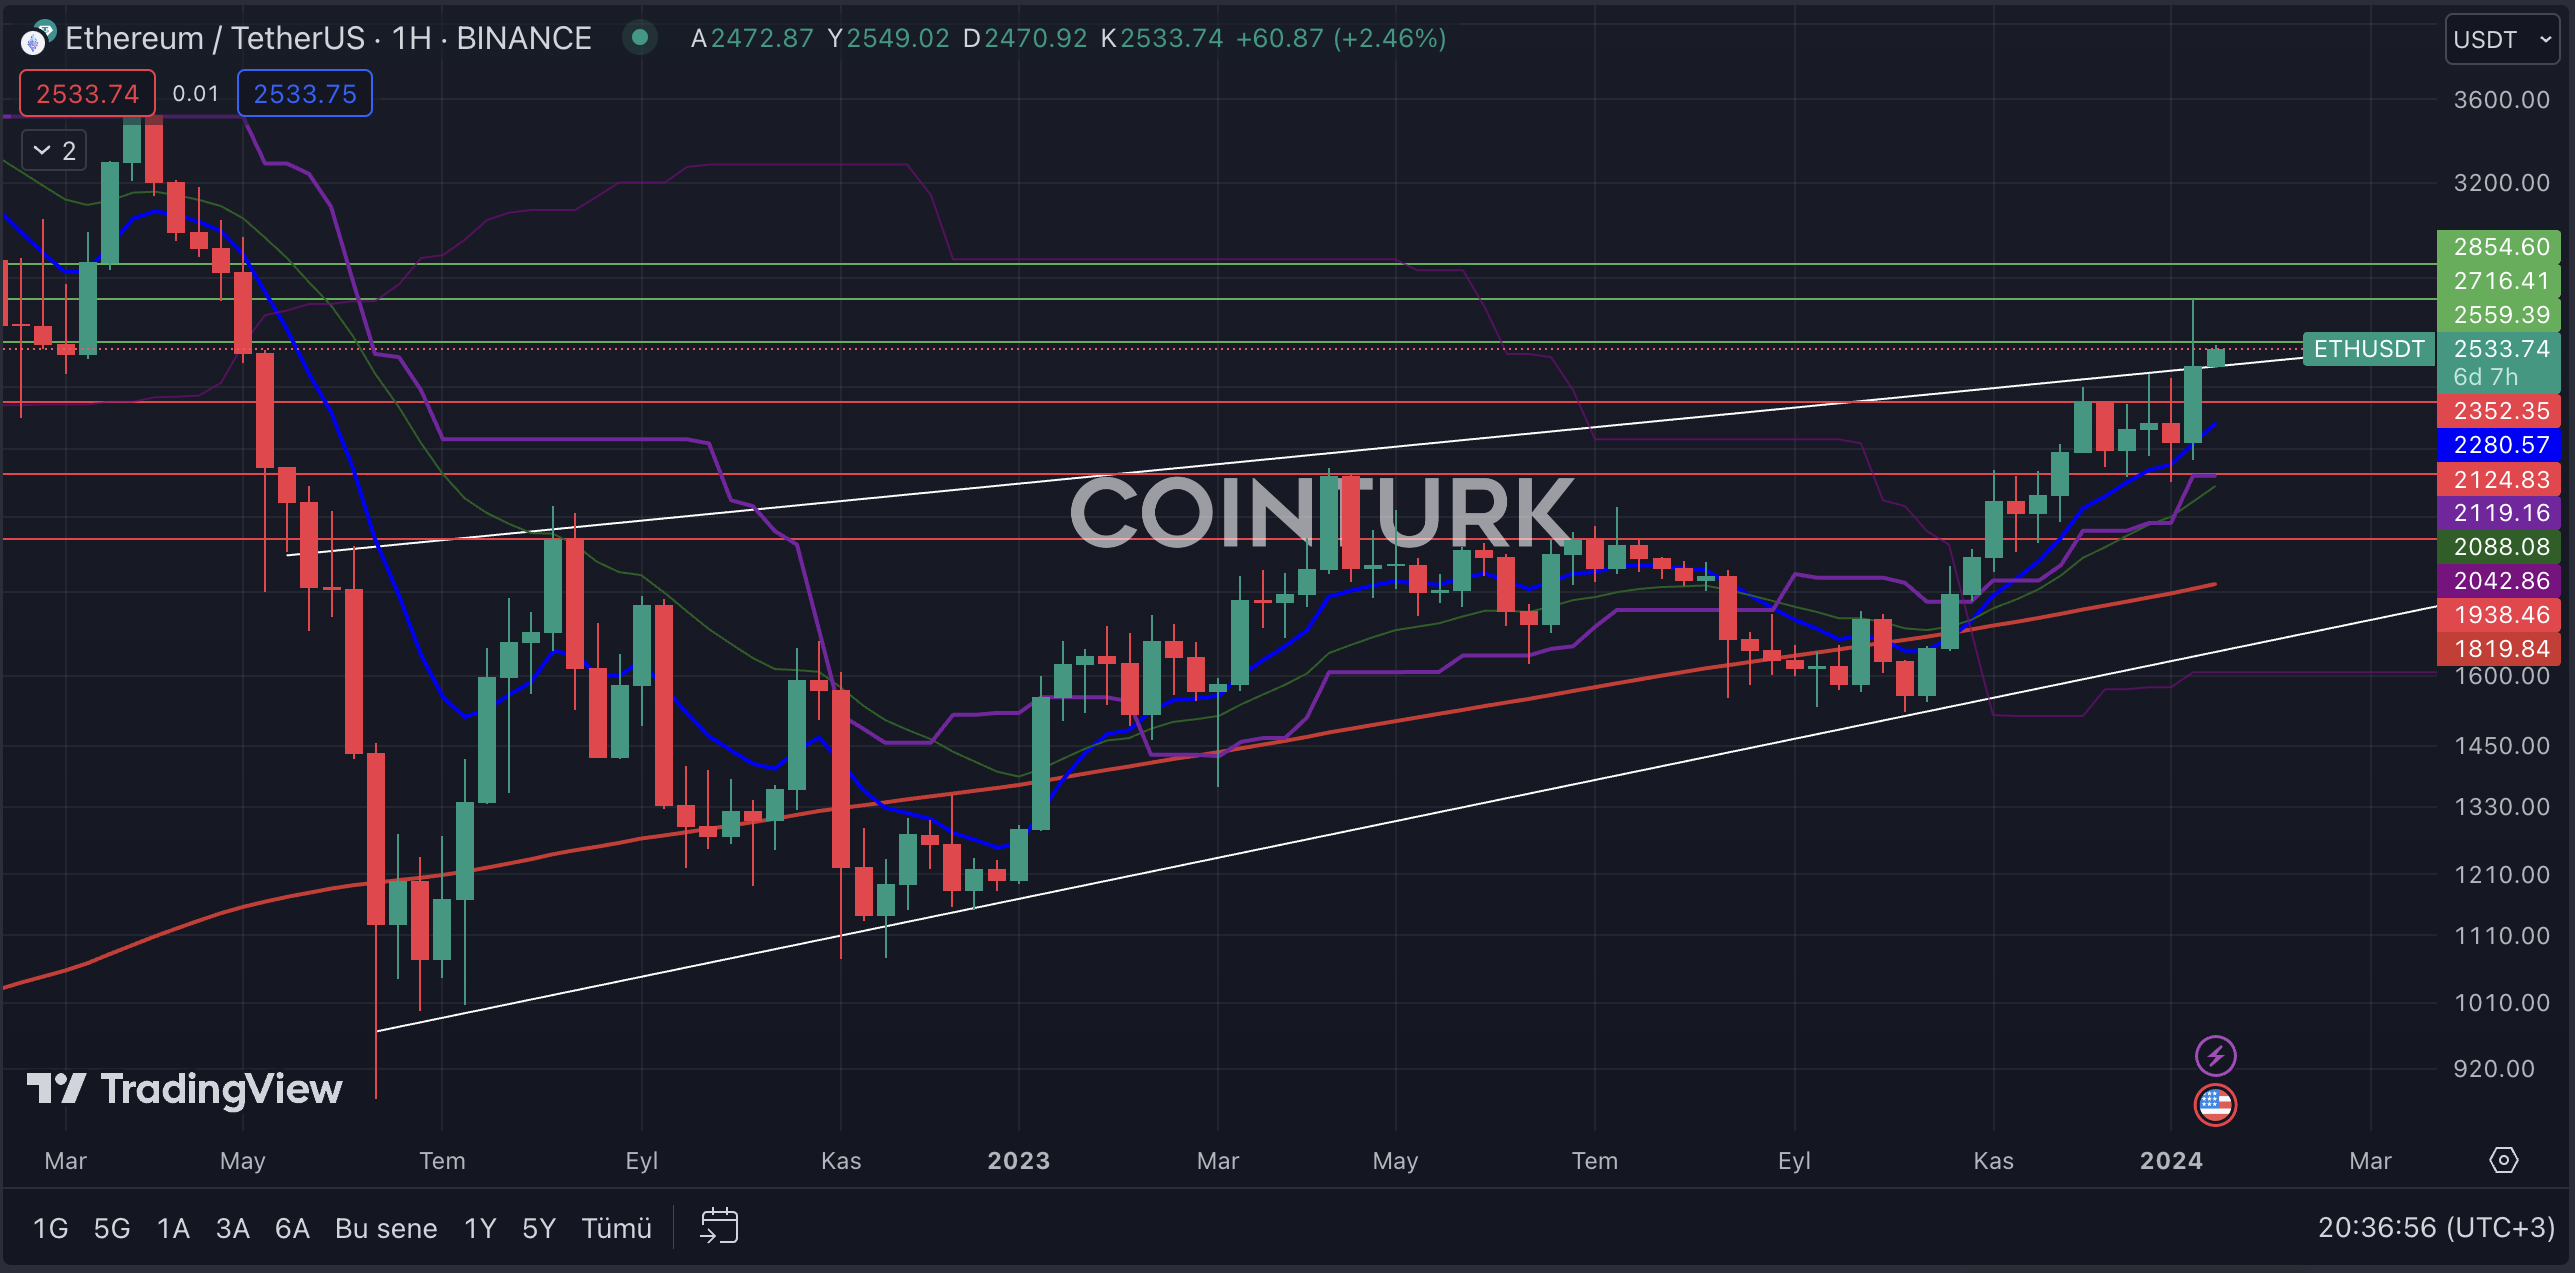
The first notable formation in the weekly Ethereum chart is a contracting wedge formation. In this formation structure, the first resistance breakout occurred in the process that started in July 2023, but the weekly close was below the resistance level. However, today’s rise has once again brought the resistance breakout into focus.
The most important support levels to watch on the weekly chart for Ethereum are, respectively; $2352 / $2124 and $1938. Particularly, a weekly bar close below the $2124 level will cause the Ethereum price to lose significant value in the long term.
The most important resistance levels to watch on the weekly chart for Ethereum are, respectively; $2559 / $2716 and $2854. Especially, a weekly bar close above the $2559 level will help the formation structure to break upwards and assist Ethereum in gaining momentum.


 Türkçe
 Español


