Ethereum  $1,893, the second-largest asset in the cryptocurrency market, hovers around $4,350 as analysts identify two critical indicators suggesting potential for the asset to surpass the $8,000 threshold by the year’s end. Despite a 24-hour trading volume exceeding $41 billion, Ethereum faces a 2% daily and 3% weekly price drop. The Wyckoff accumulation structure and the descending wedge formation on the weekly chart highlight a breakout scenario. Institutional demand and the cost basis of active investors are poised as short-term directional determinants.
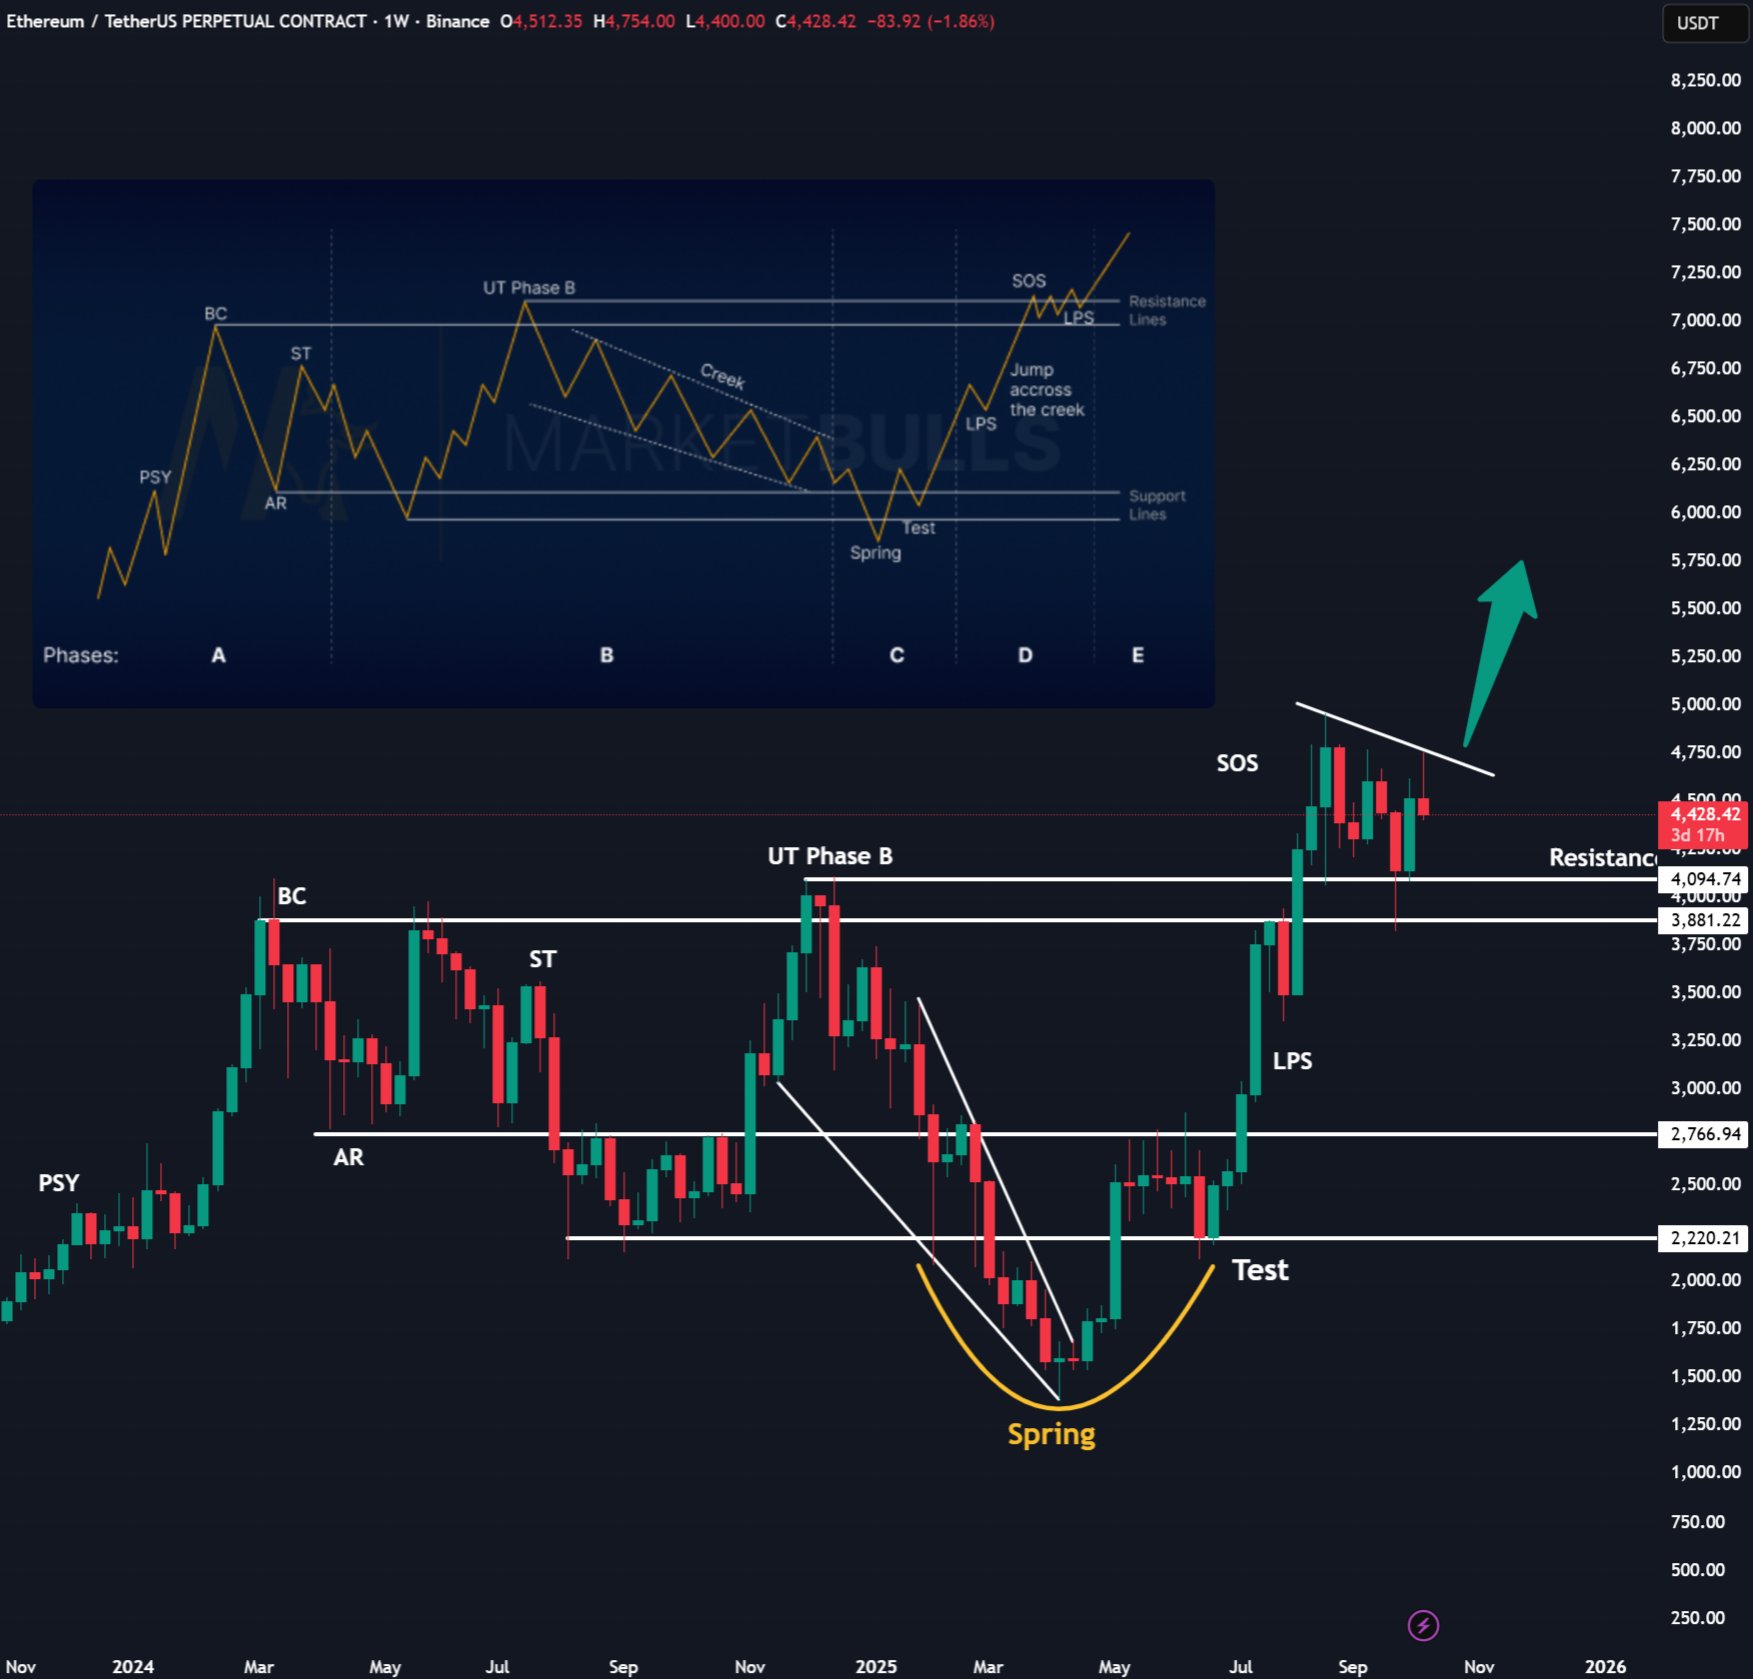
Double Technical Catalysts: Wyckoff and Wedge
ZYN, a prominent analyst, remarks that the accumulation phases on the weekly chart have concluded, with a clean “spring” and “test” below $2,500. The price nears the $4,750 resistance. According to ZYN’s scenario, the $3,880 and $4,100 regions now serve as supports. The final target indicated is $8,000 by the quarter’s end, and $10,000 by the cycle’s culmination. The analyst credits the transition of supply from weak to strong hands and an accelerated trend post-breakout for the structure’s efficacy.
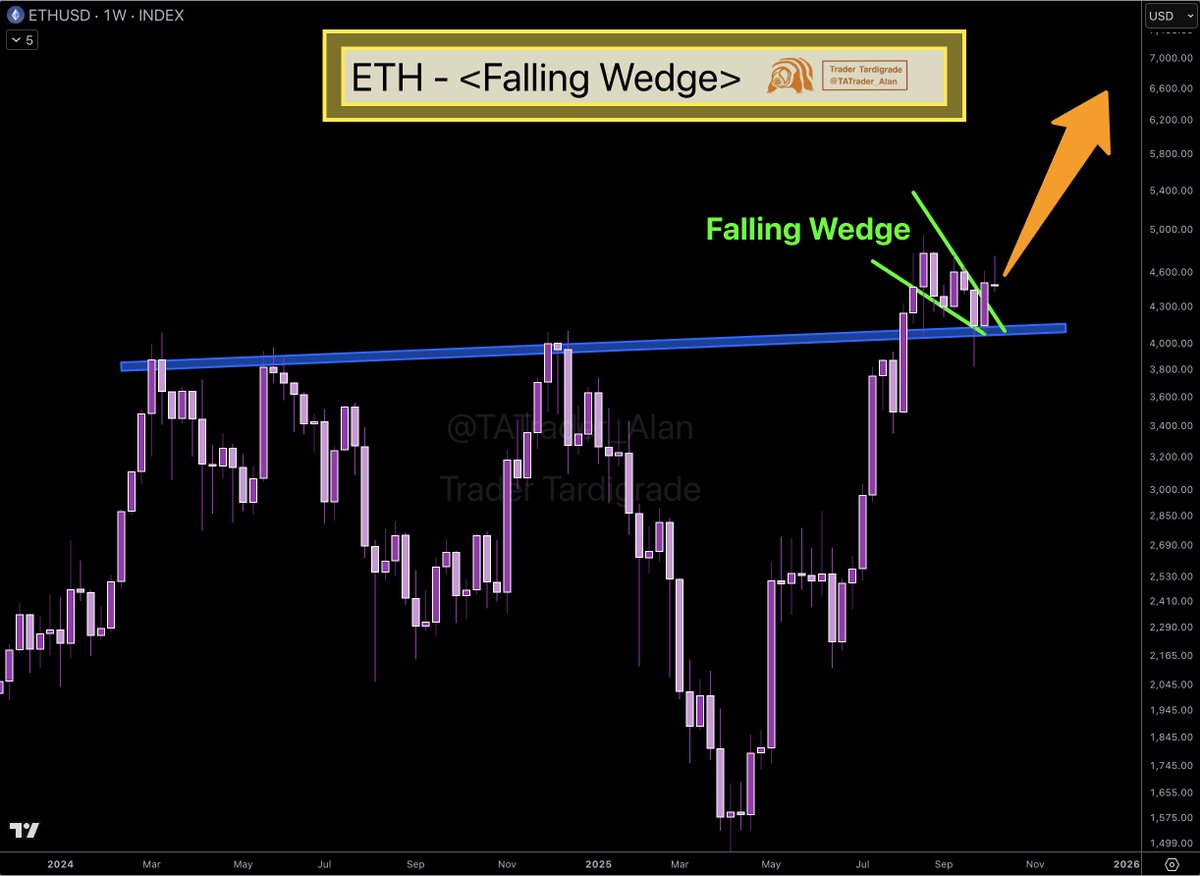
Trader Tardigrade notes the breach of the descending wedge’s upper band around $4,100 following a robust ascent. When momentum aligns with the formation rule, a measured move toward the $6,500–$7,000 range is anticipated. A resistance-support conversion at $4,100 simplifies trend following, provided weekly closes exceed $4,750.
What Do On-Chain Data Reveal?
CryptoQuant contributor Crazzyblockk notes that for addresses transacting over 100 times in the past 30 days, the realized price hovers around $4,280. Sustaining above this threshold could signal additional accumulation, while dipping below may prompt short-term selling. This threshold acts as a momentum breather point.
Market commentator Ash Crypto highlights persistent large player purchases, even as prices revert to early October levels. BlackRock, on behalf of clients, acquires approximately $1.4 billion via an ETH ETF.
In the short term, $4,240 presents a support level, with $5,000 standing as the initial strong resistance. The order book structure implies acceleration towards $6,000 if attacks surpass $5,000. As the year concludes, ETF inflows, supply withdrawn from pools, and on-chain accumulation signals are closely monitored for timing.