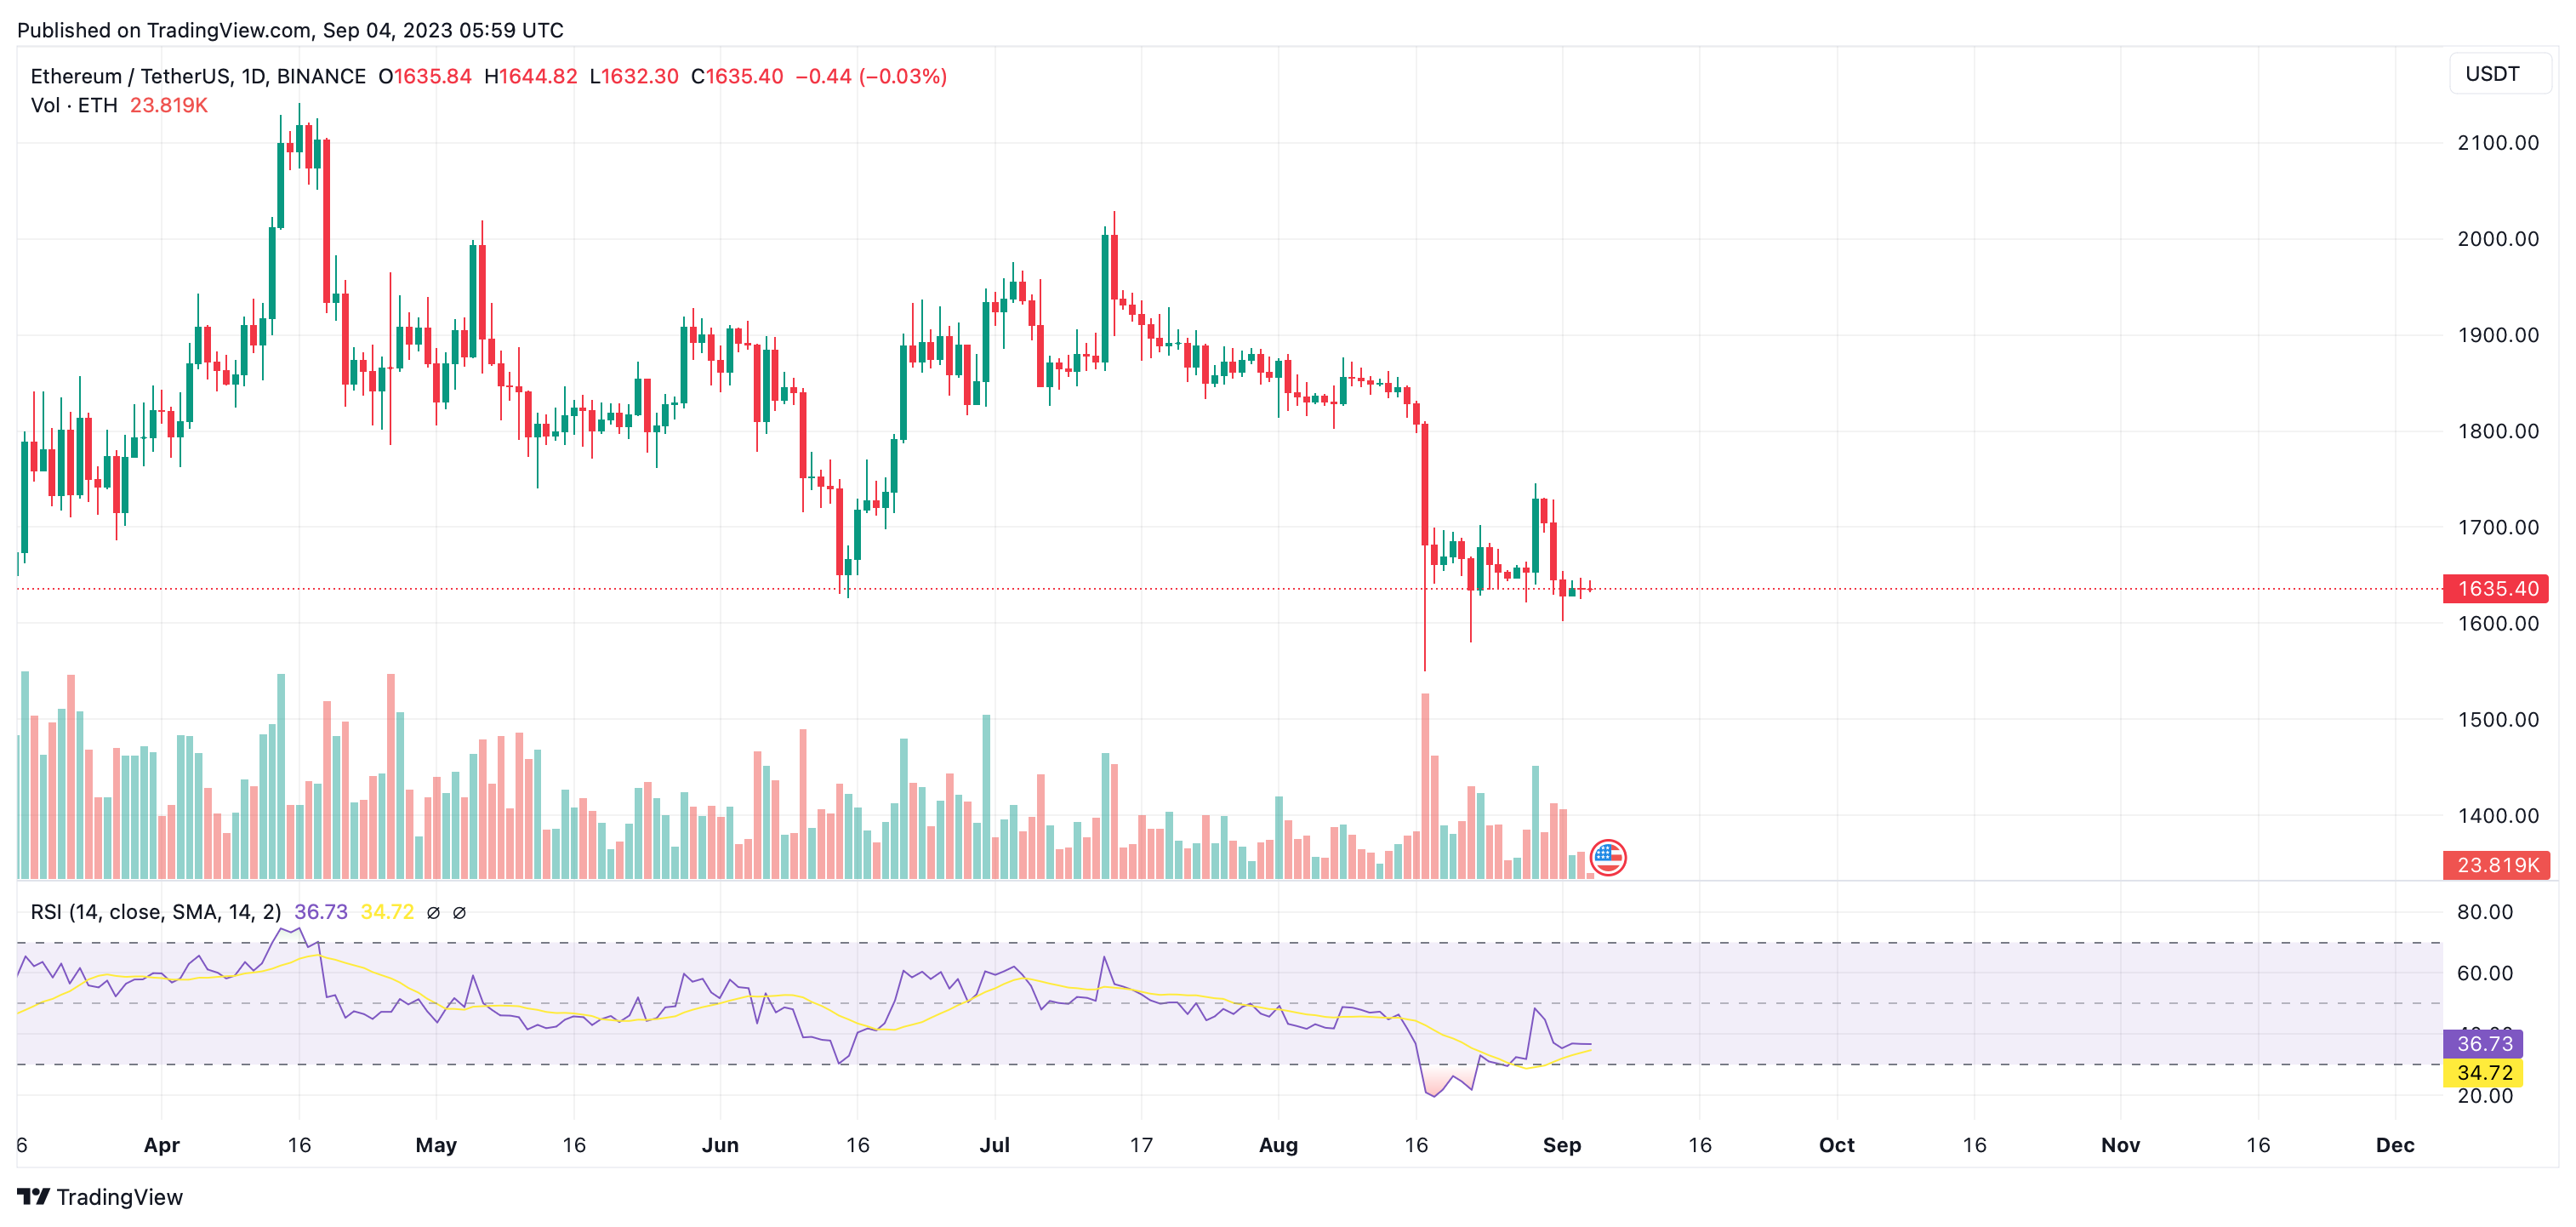
The price of the largest altcoin project, Ethereum (ETH), has been moving in an interesting way in recent days, and if not paid enough attention, the rhythm of this movement could be missed. The Relative Strength Index (RSI) divergence stands out as a strong indicator, although rarely discussed, highlighting the unique movement in ETH’s price chart. Here is the powerful bullish signal given by Ethereum’s RSI.
The Divergence Between Ethereum’s Price and RSI
At the time of writing, Ethereum (ETH) is trading at $1,636 with a modest increase of 0.03% in the last 24 hours. The divergence in its RSI signals a significant surge. As known, RSI is an important technical indicator that indicates how fast or slow the price of an asset is moving, and it is currently whispering something worth listening to.

While Ethereum’s price is moving above $1,600, its RSI presents a picture as if it is not climbing up the stairs. While the RSI is rising, ETH’s price is falling. They seem to be moving in opposite directions at a crossroads, presenting an important divergence.
Technically, this divergence indicates a classic reversal pattern. If this signal is confirmed and realized, ETH’s price could make a U-turn towards the next resistance level. Although RSI divergence is a strong signal, it is important for investors not to open positions solely based on RSI. Therefore, while RSI winks at investors, other developments surrounding altcoins and the cryptocurrency market as a whole should be closely monitored.
What is RSI?
RSI is an important indicator used in technical analysis and is often used to identify overbought or oversold conditions. RSI helps measure the strength and speed of price movements of an asset. Generally, the following steps are followed to calculate RSI:
Firstly, the average gain and average loss of the asset over a specific period (e.g., 14 days) are calculated. To calculate RSI, the ratio of average gain to average loss (RS) is determined. RS is found by dividing Average Gain by Average Loss. RSI is calculated by converting RS into a value between 0 and 100, using the formula 100 – (100 / (1 + RS)).
RSI typically ranges between 0 and 100. These values help determine whether an asset is in overbought or oversold conditions. RSI values of 70 and above may indicate overbought conditions and increase the likelihood of a price decrease. RSI values of 30 and below may indicate oversold conditions and increase the likelihood of a price increase. Investors can make trading decisions using RSI, but RSI should be used in conjunction with other technical analysis tools and information, as a standalone indicator can be misleading.


