The cryptocurrency market has recently embarked on a quite exciting journey. The leading cryptocurrency Bitcoin, after reaching its all-time high, experienced a pullback, and Ethereum also got its share of this situation. However, Ethereum‘s situation is following a unique trajectory.
A Different Scenario Unfolds for Altcoin Ethereum
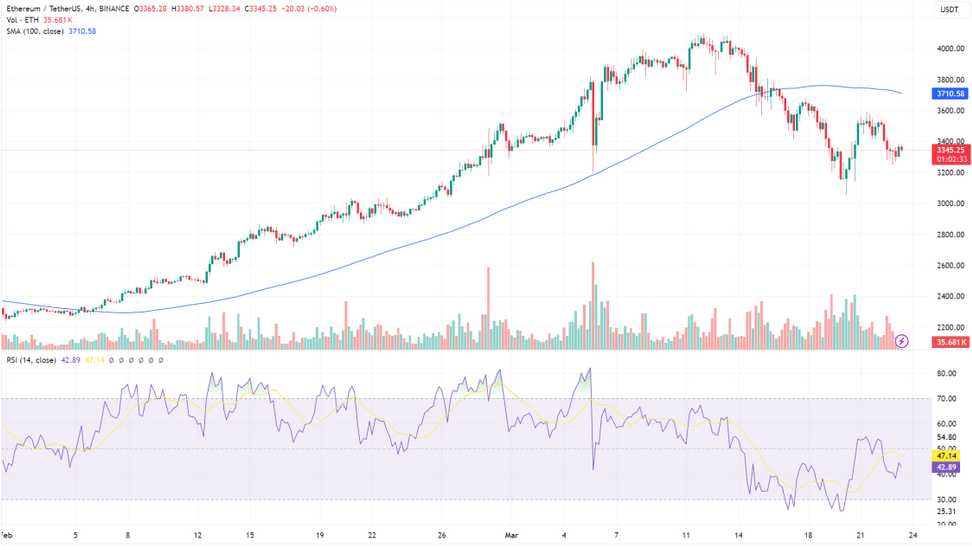
The cryptocurrency Ethereum, after seeing its yearly high of $4,094, faced a downward movement. This led to the price trading below the 100-day Moving Average (MA) in both the 1-hour and 4-hour time frames. However, a different picture emerges in the daily time frame.

So, what path will Ethereum’s price take from here on? This question is on the lips of many cryptocurrency investors. At the moment, the price of Ethereum is trading around approximately $3,360 and has recorded an increase of 0.64% in the last 24 hours.
However, the real question that intrigues everyone is: Will the price continue downward, or will it reverse direction and start an upward movement? This is indeed a critical point. The volatile nature and uncertainty of the cryptocurrency markets make it difficult to make a definite prediction. At this point, it is beneficial to look at support and resistance levels.
Support and Resistance Levels for ETH
Currently, a support level at $3,067 and corresponding resistance levels at $3,681 and $3,591 can be identified through technical analysis. However, these levels may change with the constant movement of the market.
When examining the 4-hour time frame chart, it is observed that the price is trading below the 100-day moving average. This indicates that the price is in a downtrend.
Looking at the Relative Strength Index (RSI) indicator, it is seen that the RSI signal line is trading below the 50 line. This can be interpreted as a strong signal that the price of the king of altcoins, Ethereum, is in a downward trend.
A closer look at the MACD indicator in the 4-hour time frame shows that the MACD histogram has fallen below the zero line and both the MACD line and the signal line have crossed below the zero line. This suggests that the price is still in a downtrend and this trend could continue.

 Türkçe
 Español


