Cryptocurrency market downturns have led to selling pressures on many Bitcoin and altcoin projects. However, leading memecoin projects have witnessed significant rises during this period. Let’s explore what’s happening with Bonk, Pepe, and Hedera recently.
BONK Chart Analysis
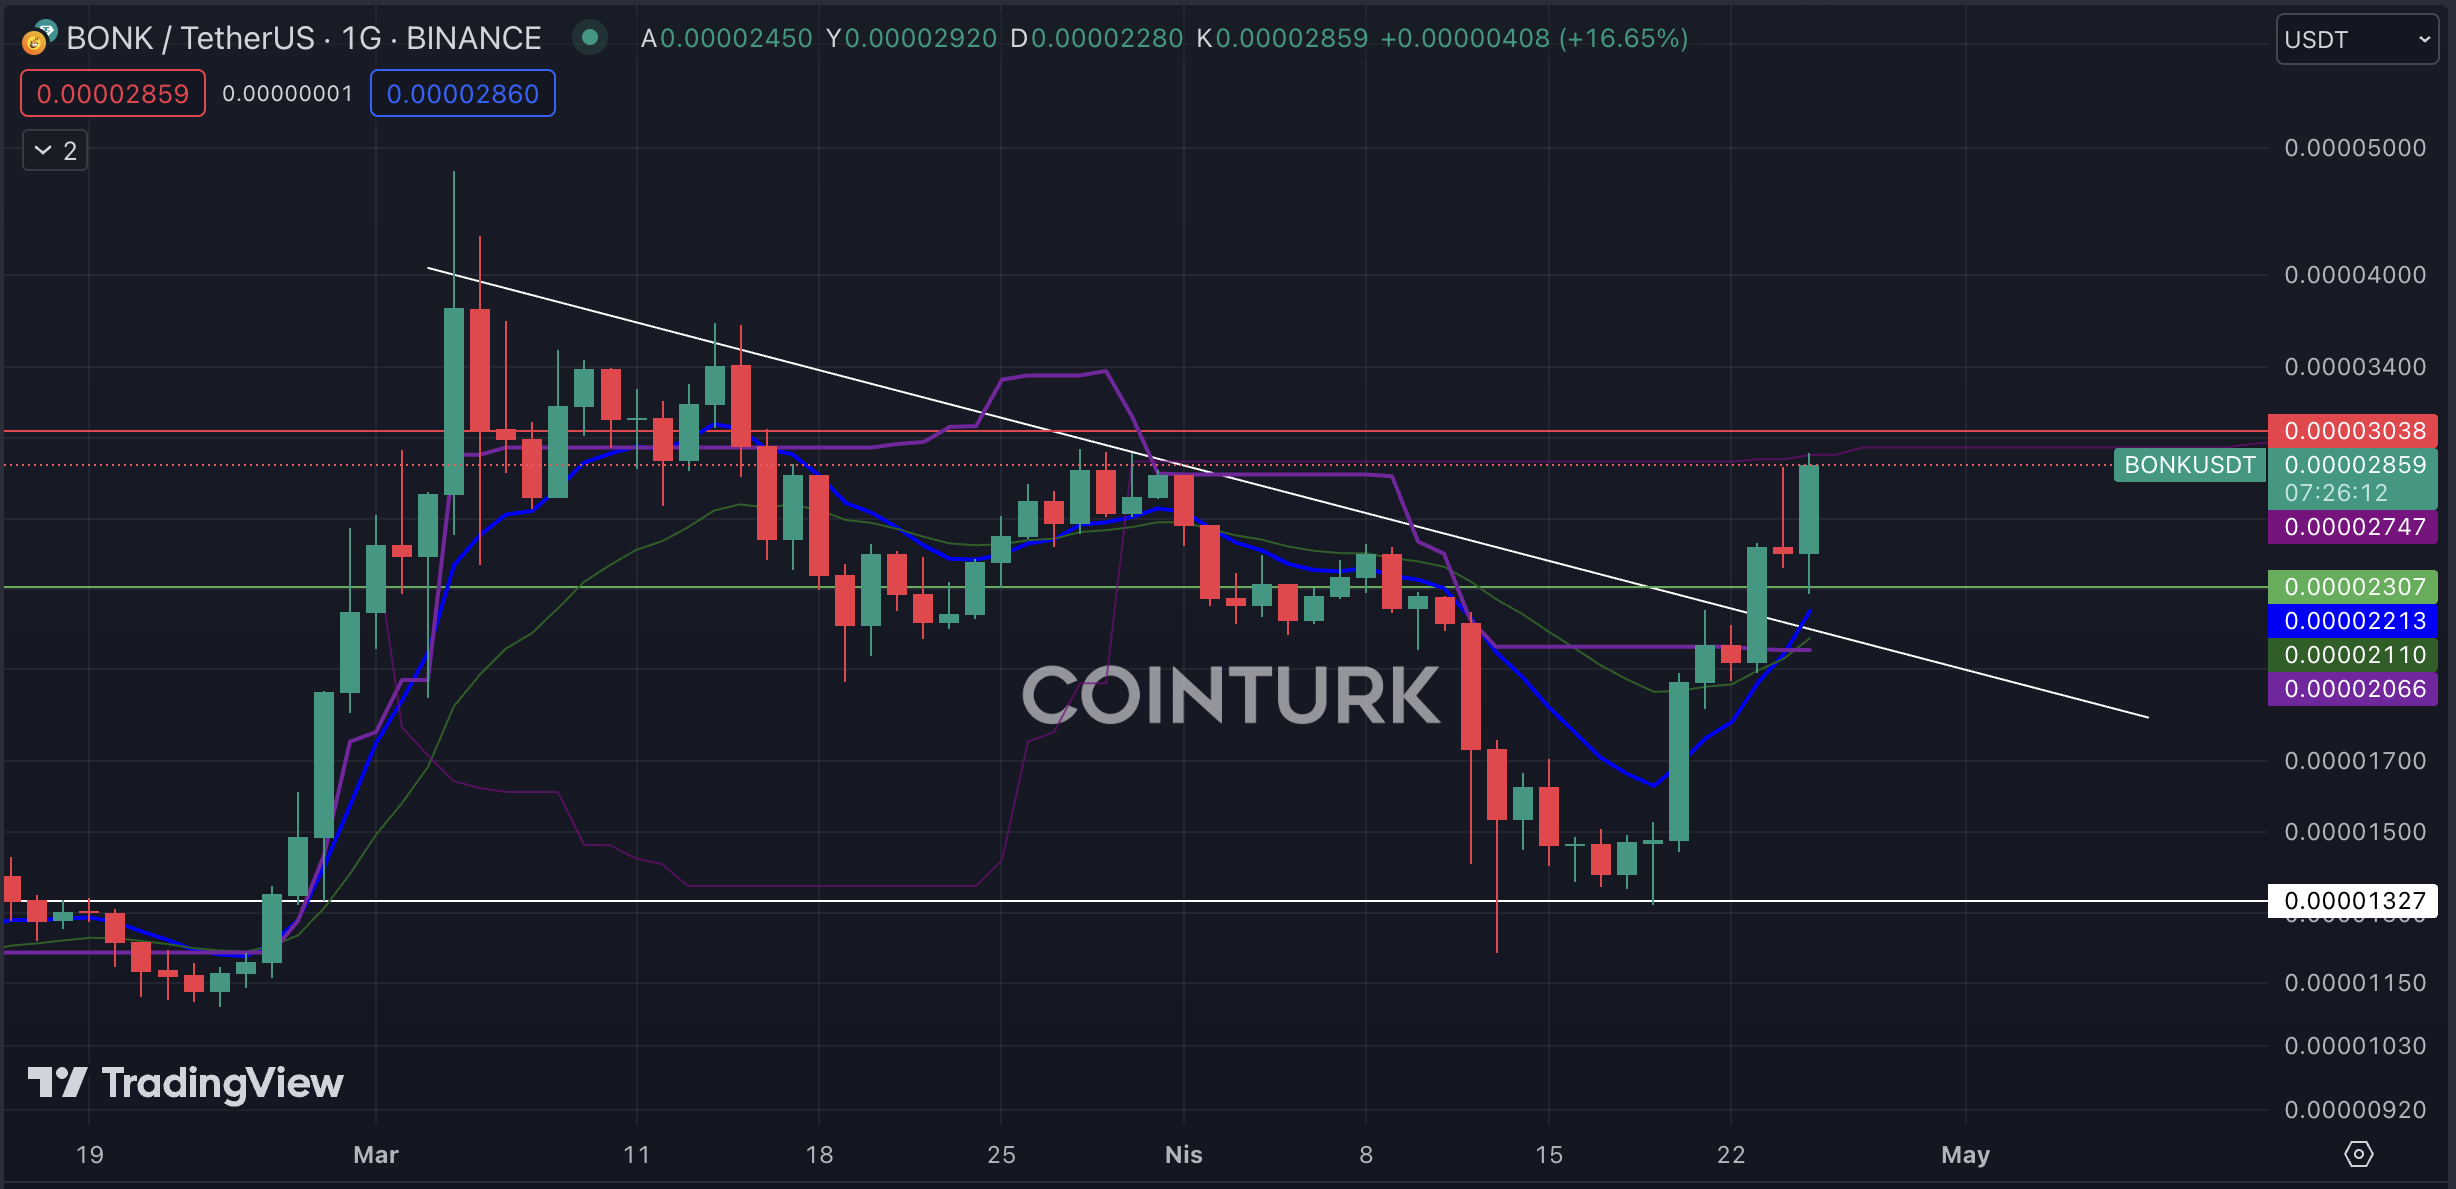
BONK, a popular memecoin within the Solana ecosystem, faced significant selling pressure after peaking on March 5. Recently, BONK gained momentum from its support line, broke the falling trend line, and continued its ascent as the trend line began to act as support.
The most critical support level to monitor on the daily chart for BONK is at $0.00002307. Closures below this level could increase selling pressure for BONK. The most crucial resistance level to watch is $0.00003038.

PEPE Chart Analysis
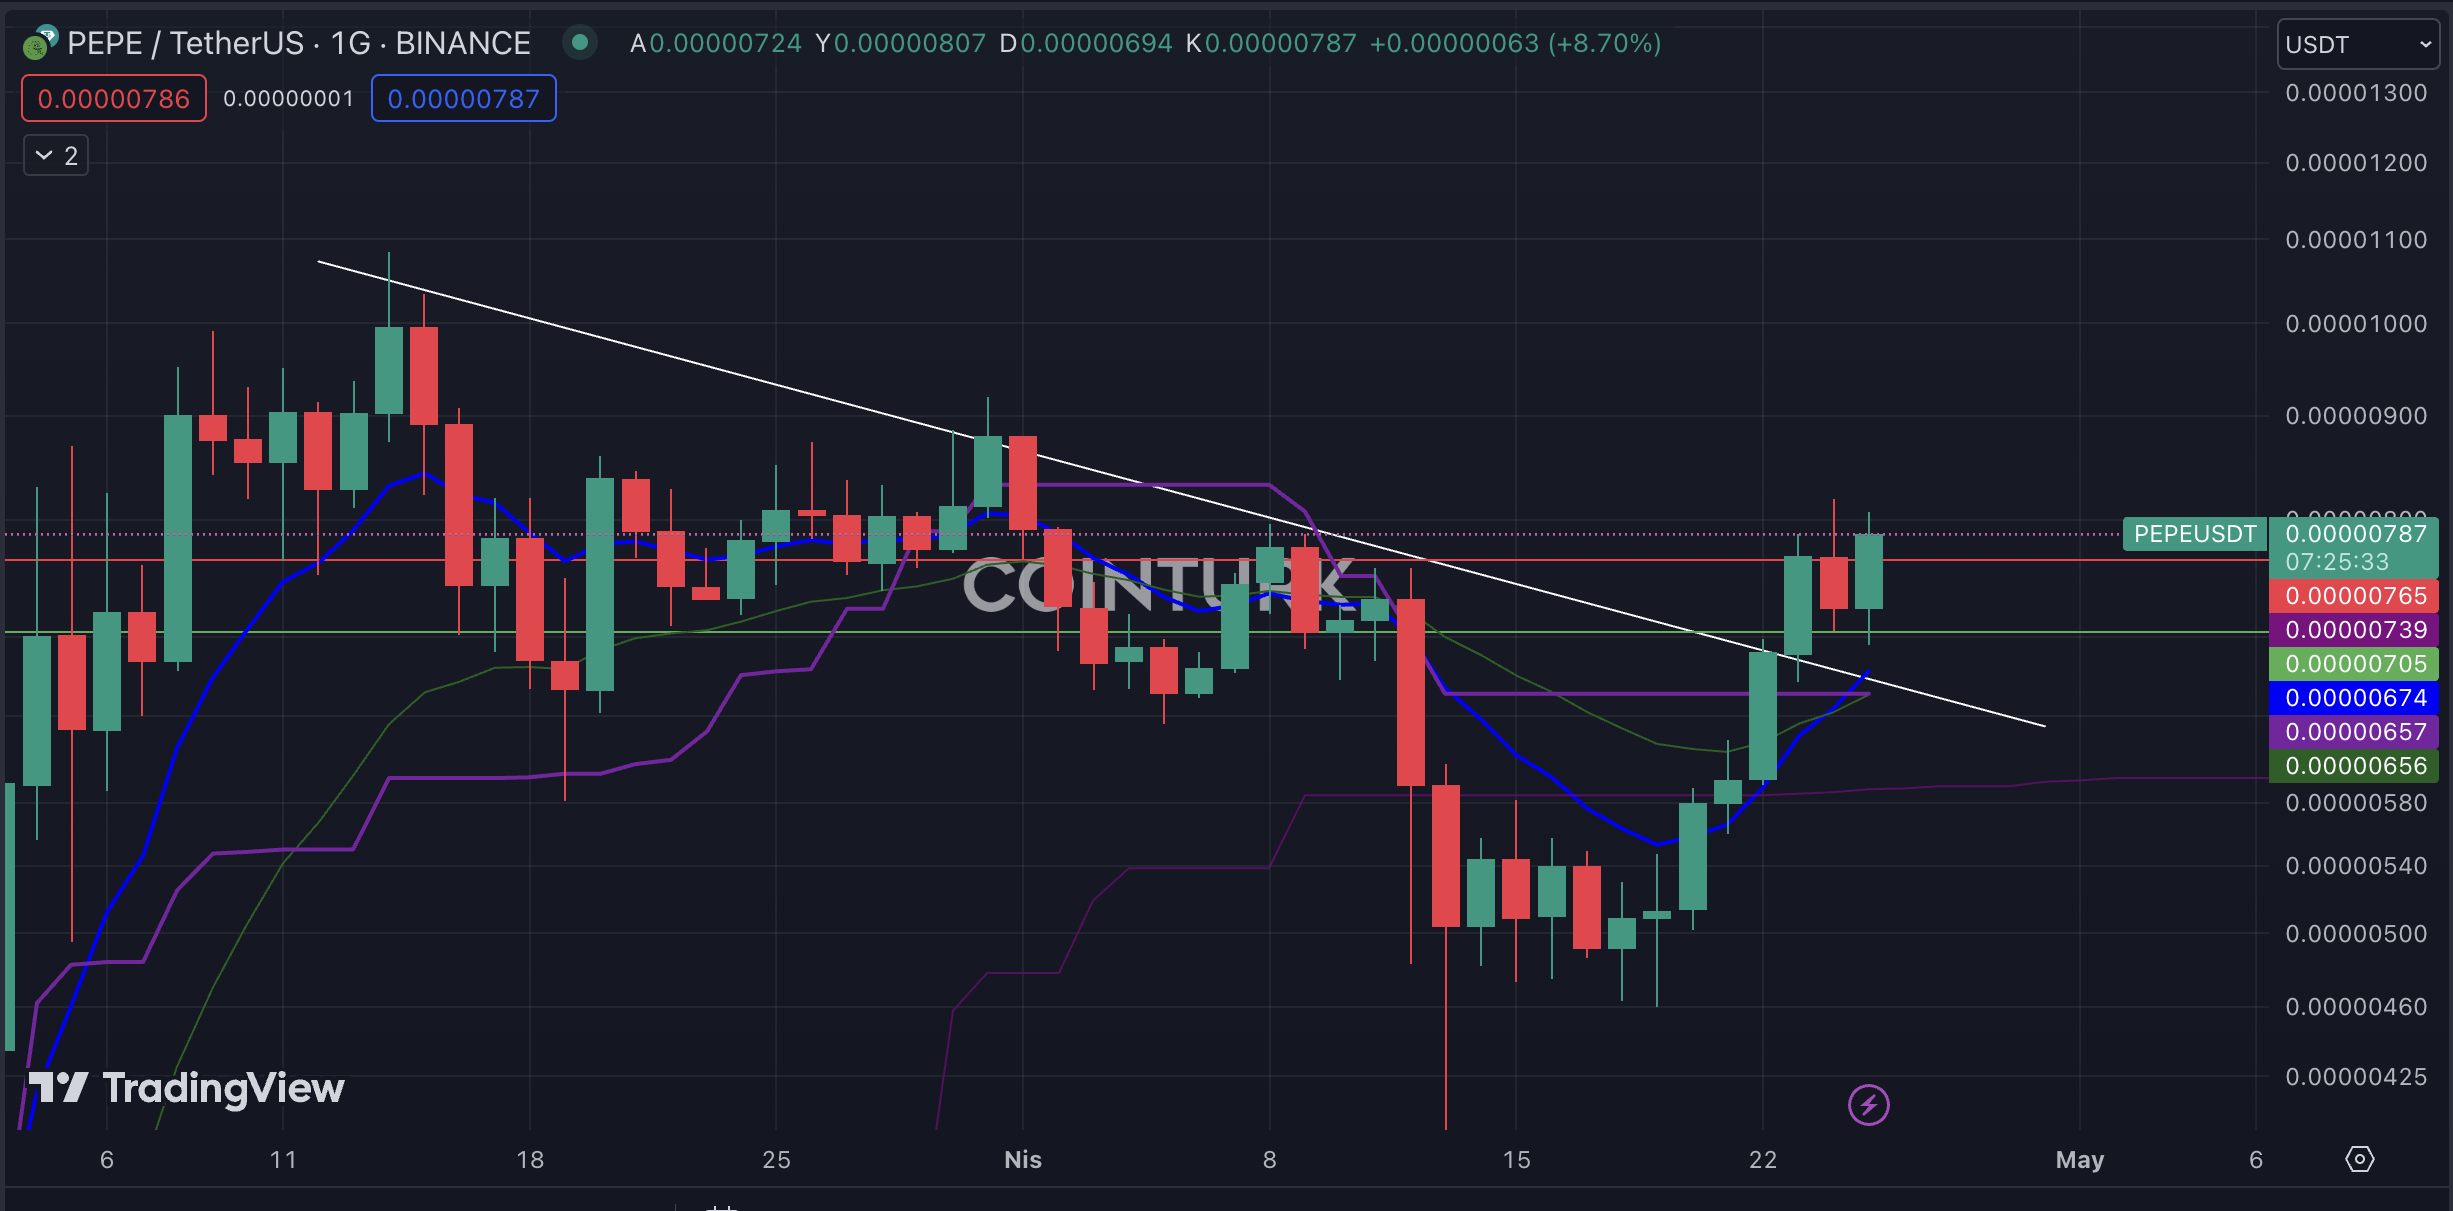
The daily PEPE chart is undergoing a similar process to BONK, indicating a notable hype in the memecoin space. A breakout of the falling trend has occurred, and the trend line is now acting as support.
The most important support level for PEPE on the daily chart is $0.00000705. Closures below this level could generate selling pressure for PEPE. The critical resistance level to observe is $0.00000787, where closures above could accelerate PEPE’s momentum.
Hedera Chart Analysis
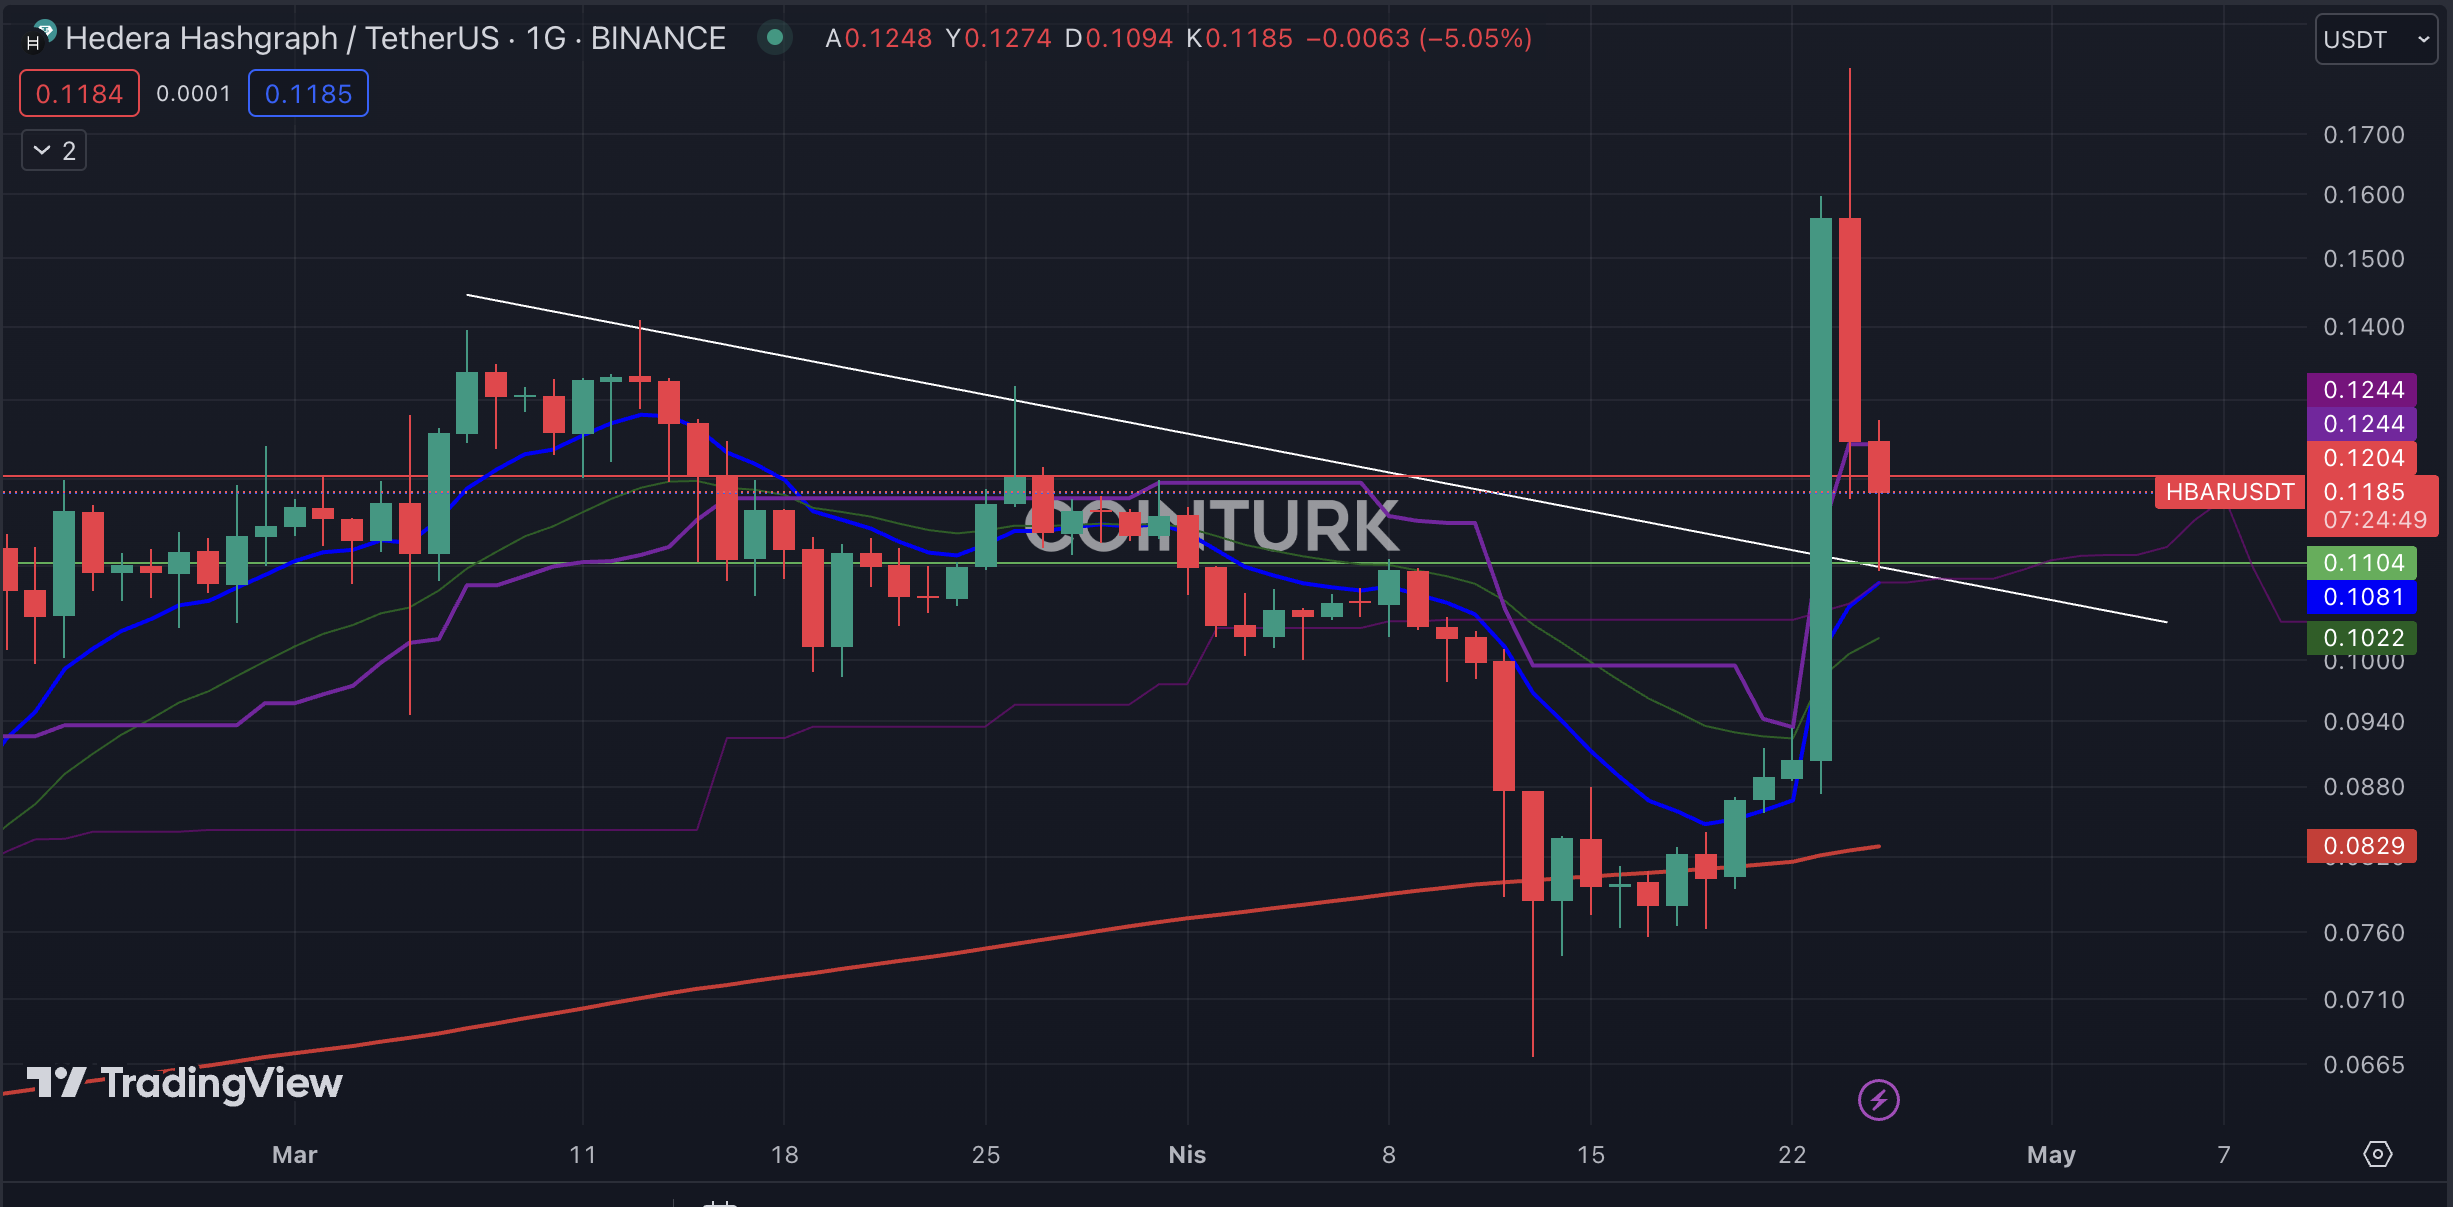
Developments on the Hedera front led to a price surge of over 90% in one day. However, a subsequent announcement revealed that the news-driven surge was unfounded, leading to significant selling pressure on Hedera’s price. Despite this, Hedera managed to stay above the falling trend line, keeping the potential for further rises on the agenda.

The most important support level for Hedera on the daily chart is $0.1104. Closures below this level could lead to increased selling pressure. The key resistance level is $0.1204, where closures above could boost Hedera’s price. Also, check out our technical analysis video published today on our YouTube channel:

 Türkçe
 Español


