Bitcoin halving has been successfully completed. Following the halving, the price recently soared to $67,000. This price increase gradually began to influence altcoins. MATIC was one of the altcoins that stood out during this period. A renowned analyst shared his views on MATIC.
Analyst’s Comments on MATIC
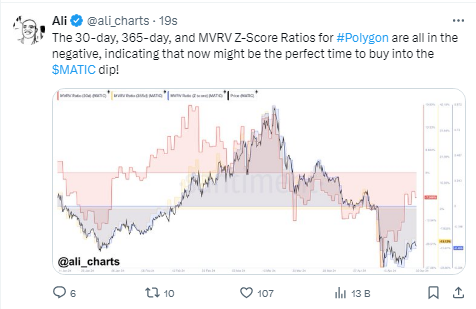
Crypto analyst Ali Martinez, in a post on X, emphasized that the Market Value to Realized Value (MVRV) ratio of MATIC, which serves as the native token of Polygon, might be indicating a buying signal.
According to the analyst’s review, the MVRV ratio, which evaluates different moving averages of the token, had negative values. According to data provided by Santiment, the 30-day and 365-day MVRV ratios for MATIC were -10.11% and 11.99% respectively at the time of writing.

MVRV ratio is obtained by determining the ratio between the current market price of an asset and the average price of each coin or token purchased included in the calculation.
An MVRV ratio above 1 indicates a positive outlook, reflecting that a crypto asset might be overvalued.
It shows that the current market value of a crypto asset is significantly higher compared to the price at which most investors made purchases in the past. A negative MVRV, on the other hand, indicates the opposite.
According to Martinez, the negative MVRV ratio of MATIC could be presenting a great buying opportunity. This could be attributed to MATIC trading at lower levels compared to its historical prices.
The Future of MATIC
When evaluating MATIC’s price outlook on a daily basis, the market sentiment analysis shows a slow transition from a decline to an increase.
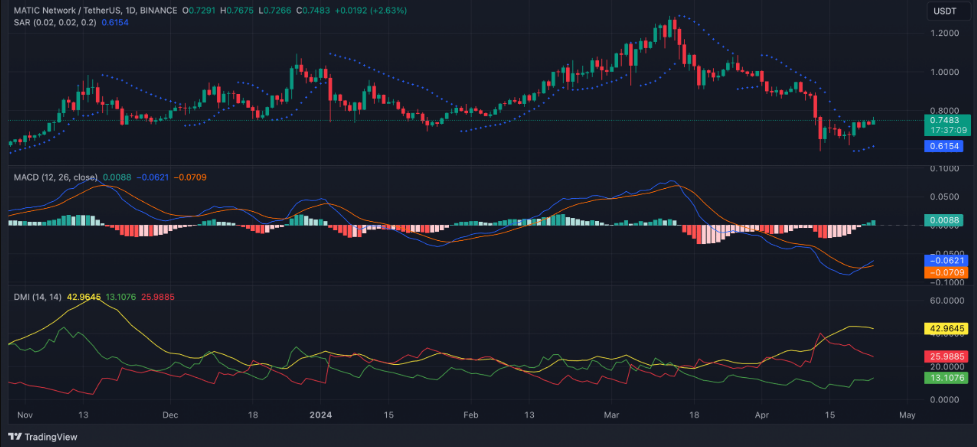
Initially, the analysis based on the Parabolic SAR indicator showed that the dots were below the price at the time of writing. This indicator is favored by analysts for identifying potential trend directions and reversals.

When dotted lines settle below the price of an asset, it indicates that the market is moving with bullish expectations. This situation could suggest that the crypto asset’s price is rising and may continue to rise.
Looking at the graph above, for the first time since March 15, MATIC’s MACD line (blue) is now positioned above the signal line (orange). In such scenarios, it is said that an asset’s shorter-term average is above its longer-term average.
This generally is perceived as a bullish signal in the market. Investors positioning in the market might consider this as a sign to take a position or exit existing short positions.
However, even though buying activities might have returned in the MATIC market, bearish trends continue to hold significance.
For instance, the negative index (red) still remains above the positive index (green). This assessment indicates that the strength of MATIC bears still surpasses that of the bulls, and the selling momentum remains high.


