Solana ecosystem’s recent network congestion issue has been resolved with an update. During this period, the SOL price encountered significant selling pressure, leading to a loss of interest among users particularly active in the Solana ecosystem. So, what do the on-chain data and SOL charts tell us about the Solana ecosystem? Let’s explore together.
What’s Happening in the Solana Ecosystem?
Due to the network congestion in the Solana ecosystem, many users were unable to complete even the simplest transactions, creating significant issues for both airdrop hunters and memecoin investors.
It might be premature to declare the start of an optimistic phase for the Solana ecosystem following the latest update, but several data points support this theory. According to data from the blockchain analytics platform Token Terminal, transaction fees in the ecosystem exceeded $3 million on April 2, reaching the highest level in the last month. On April 20, however, transaction fees dropped to $997,446, highlighting the ongoing processes in the ecosystem.

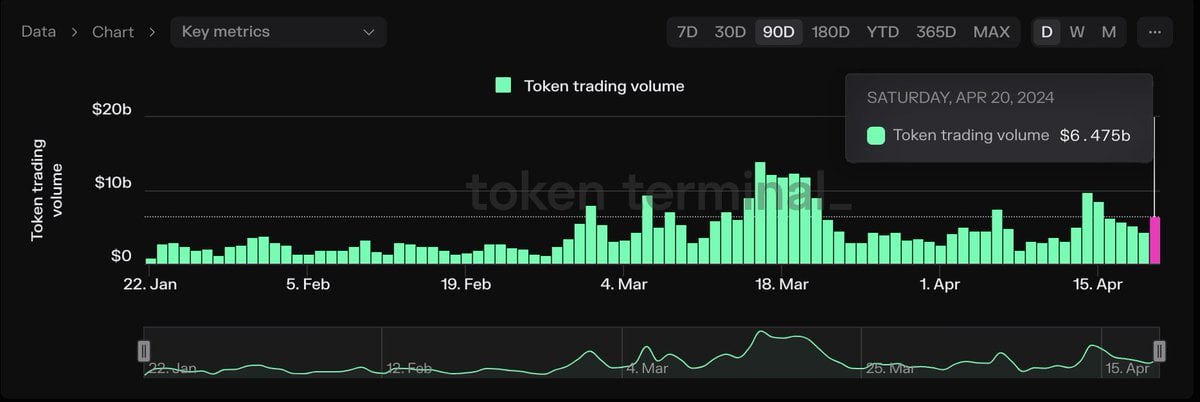
The daily trading volume in the Solana ecosystem dropped to $1.95 billion on April 9. Notably, with the rise in memecoin activity, the daily trading volume surged to $6.47 billion on April 20. The recent decline is noteworthy.
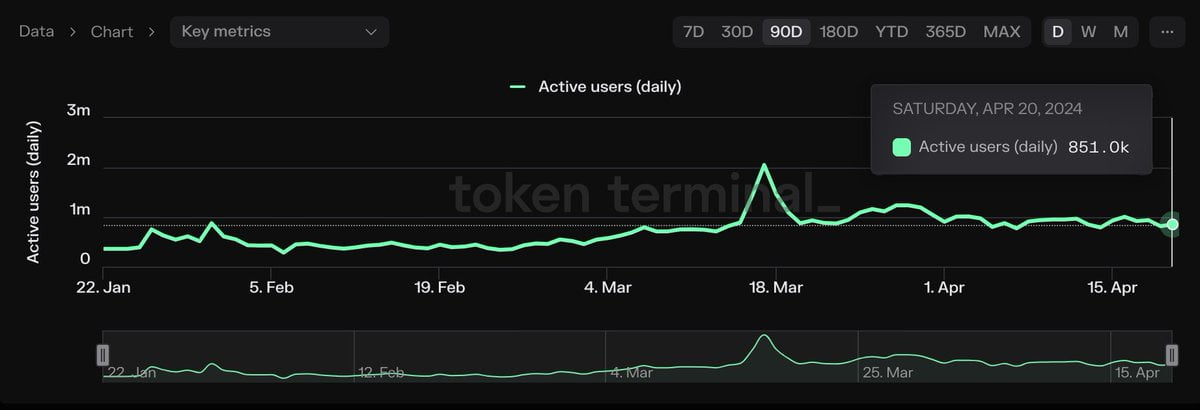
The number of daily active users in the ecosystem fell to 749,000 on April 14 but rose to 851,000 by April 20. This number needs to increase from the highest level of the last month, 1.2 million, and the decline could be due to rug-pull incidents on the network.
The Memecoin Craze Continues
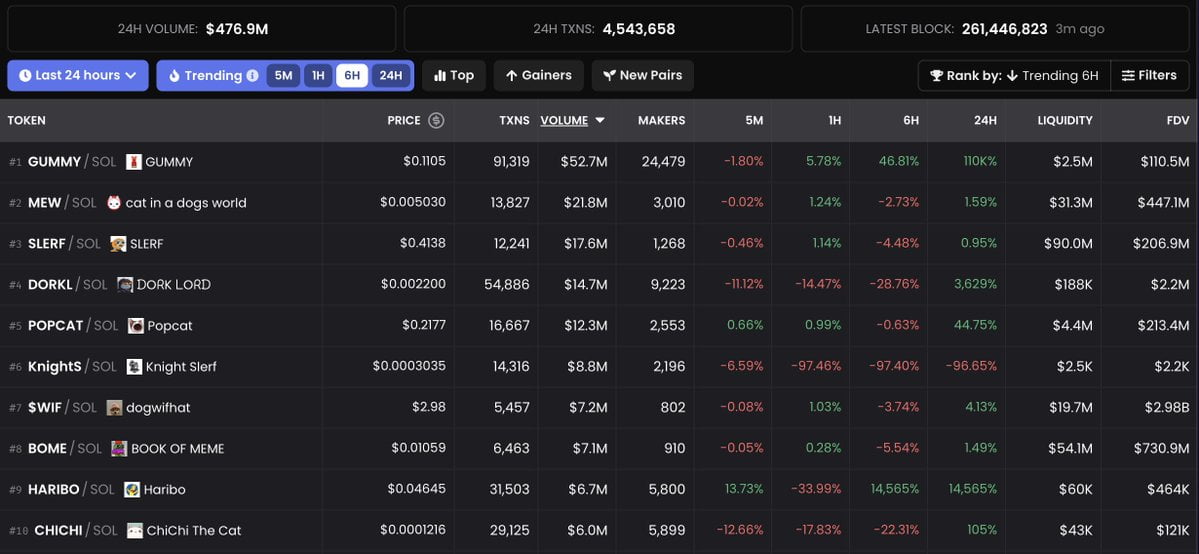
Dex Screener data shows that in the last 24 hours, the DEX platform Raydium in the Solana ecosystem saw a trading volume of $476 million. The highest trading volume in the last 24 hours was $52.7 million in the GUMMY/SOL pair, which also saw a 110,000% increase, making it the most profitable project for investors.
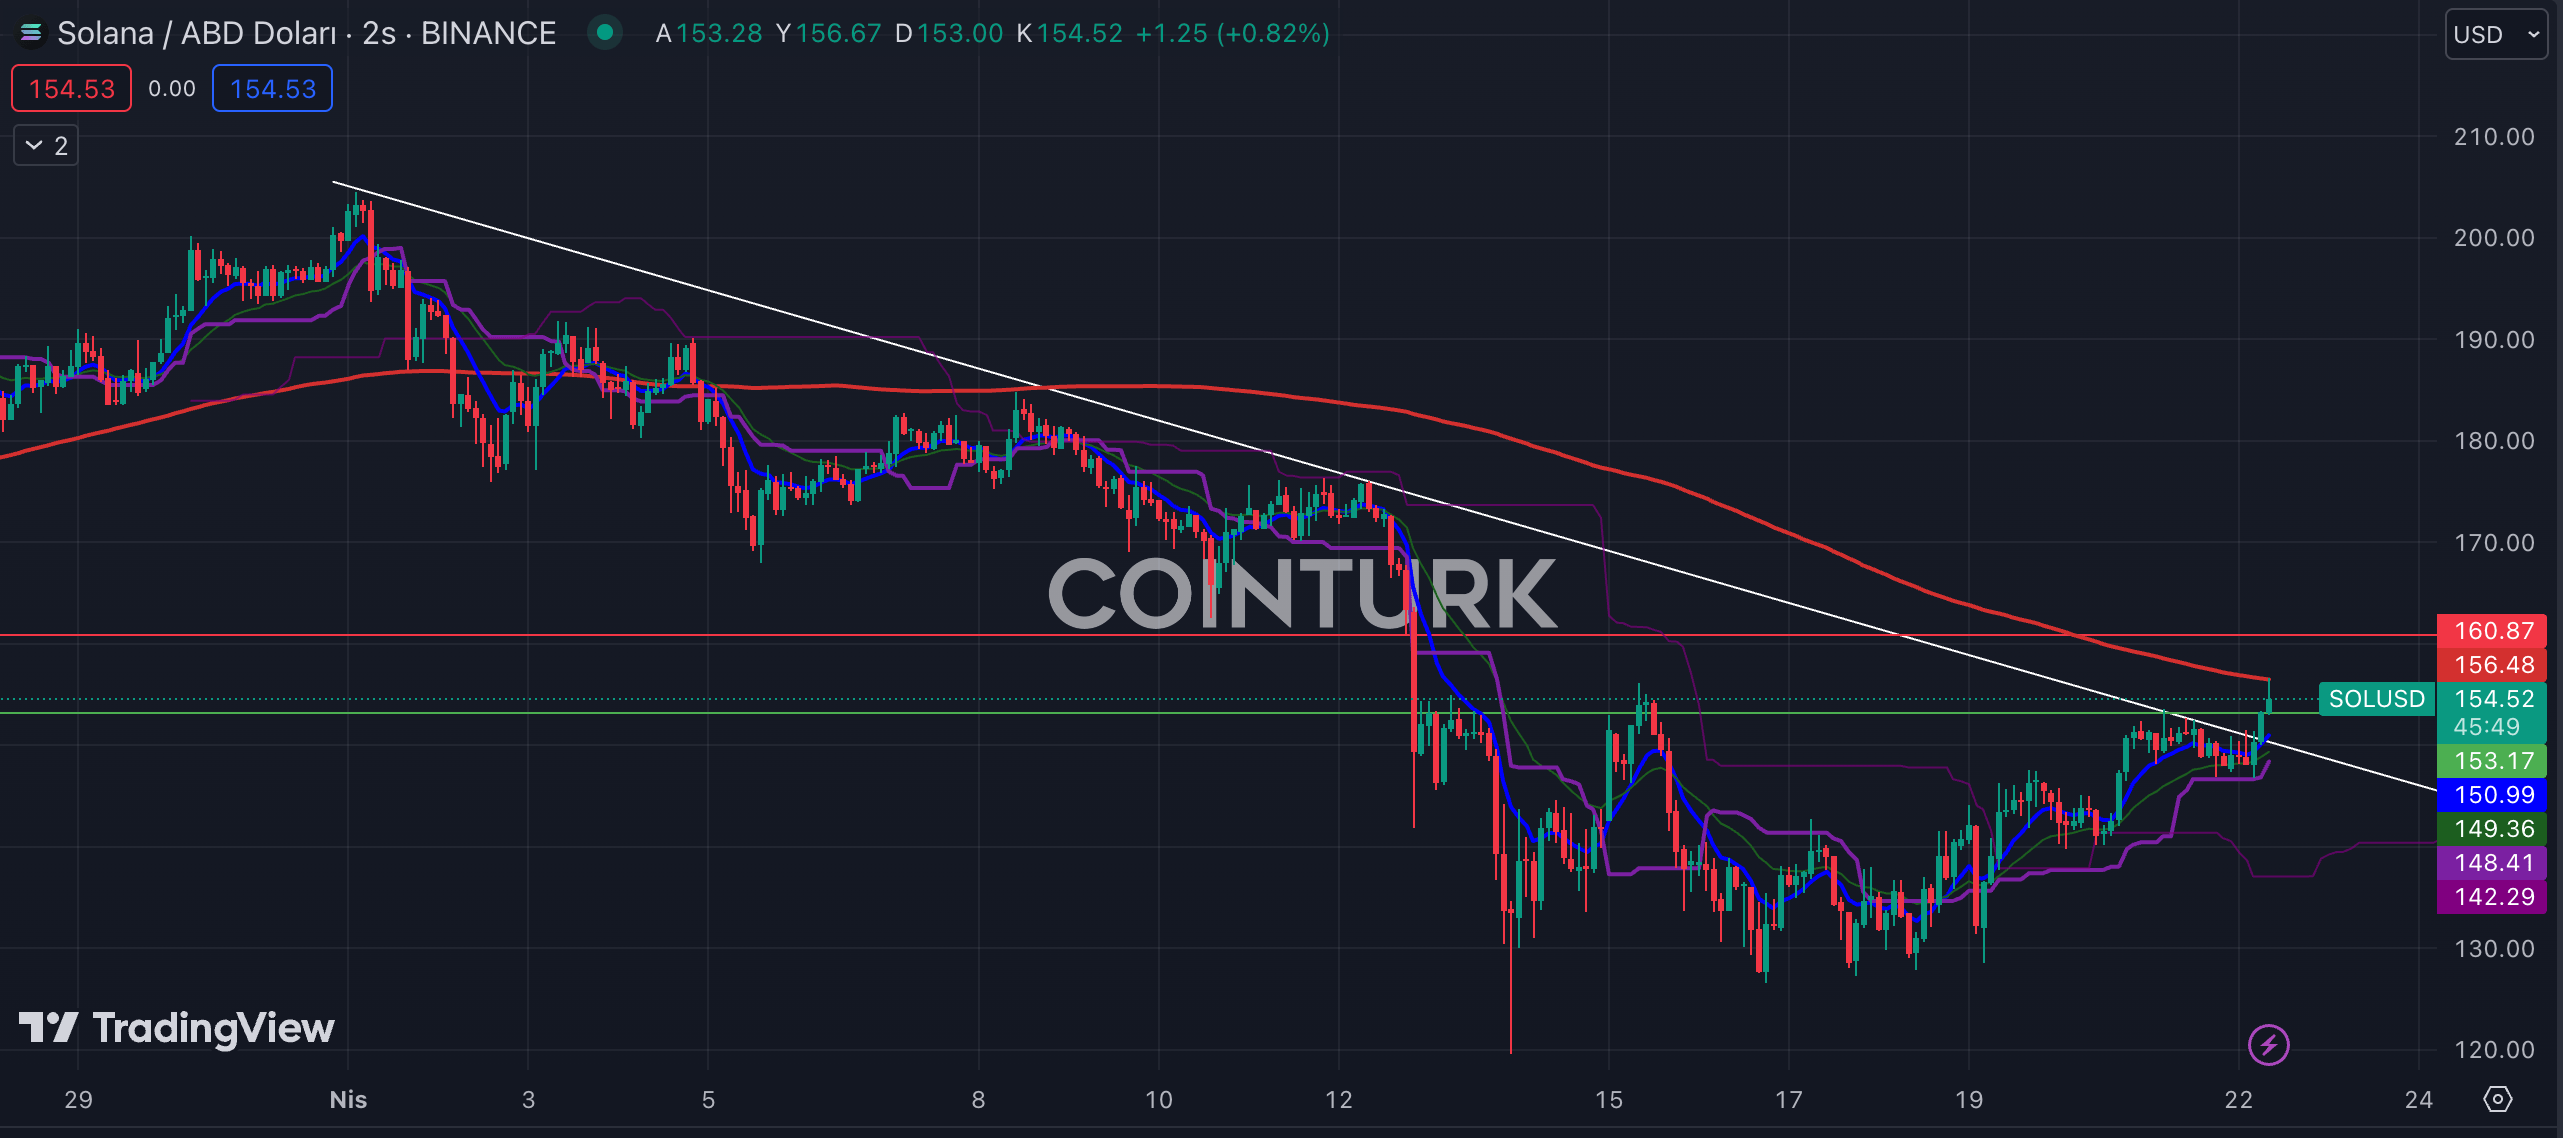
In the two-hour Solana chart, a successful breakout occurred on the falling trend line, which accelerated the price momentum. However, the recent rise met resistance at the EMA 200 (red line), which could lead to selling pressure in the short term. For Solana, the $153.17 level can be considered as support, while the $160.87 level can be monitored as resistance.

 Türkçe
 Español


