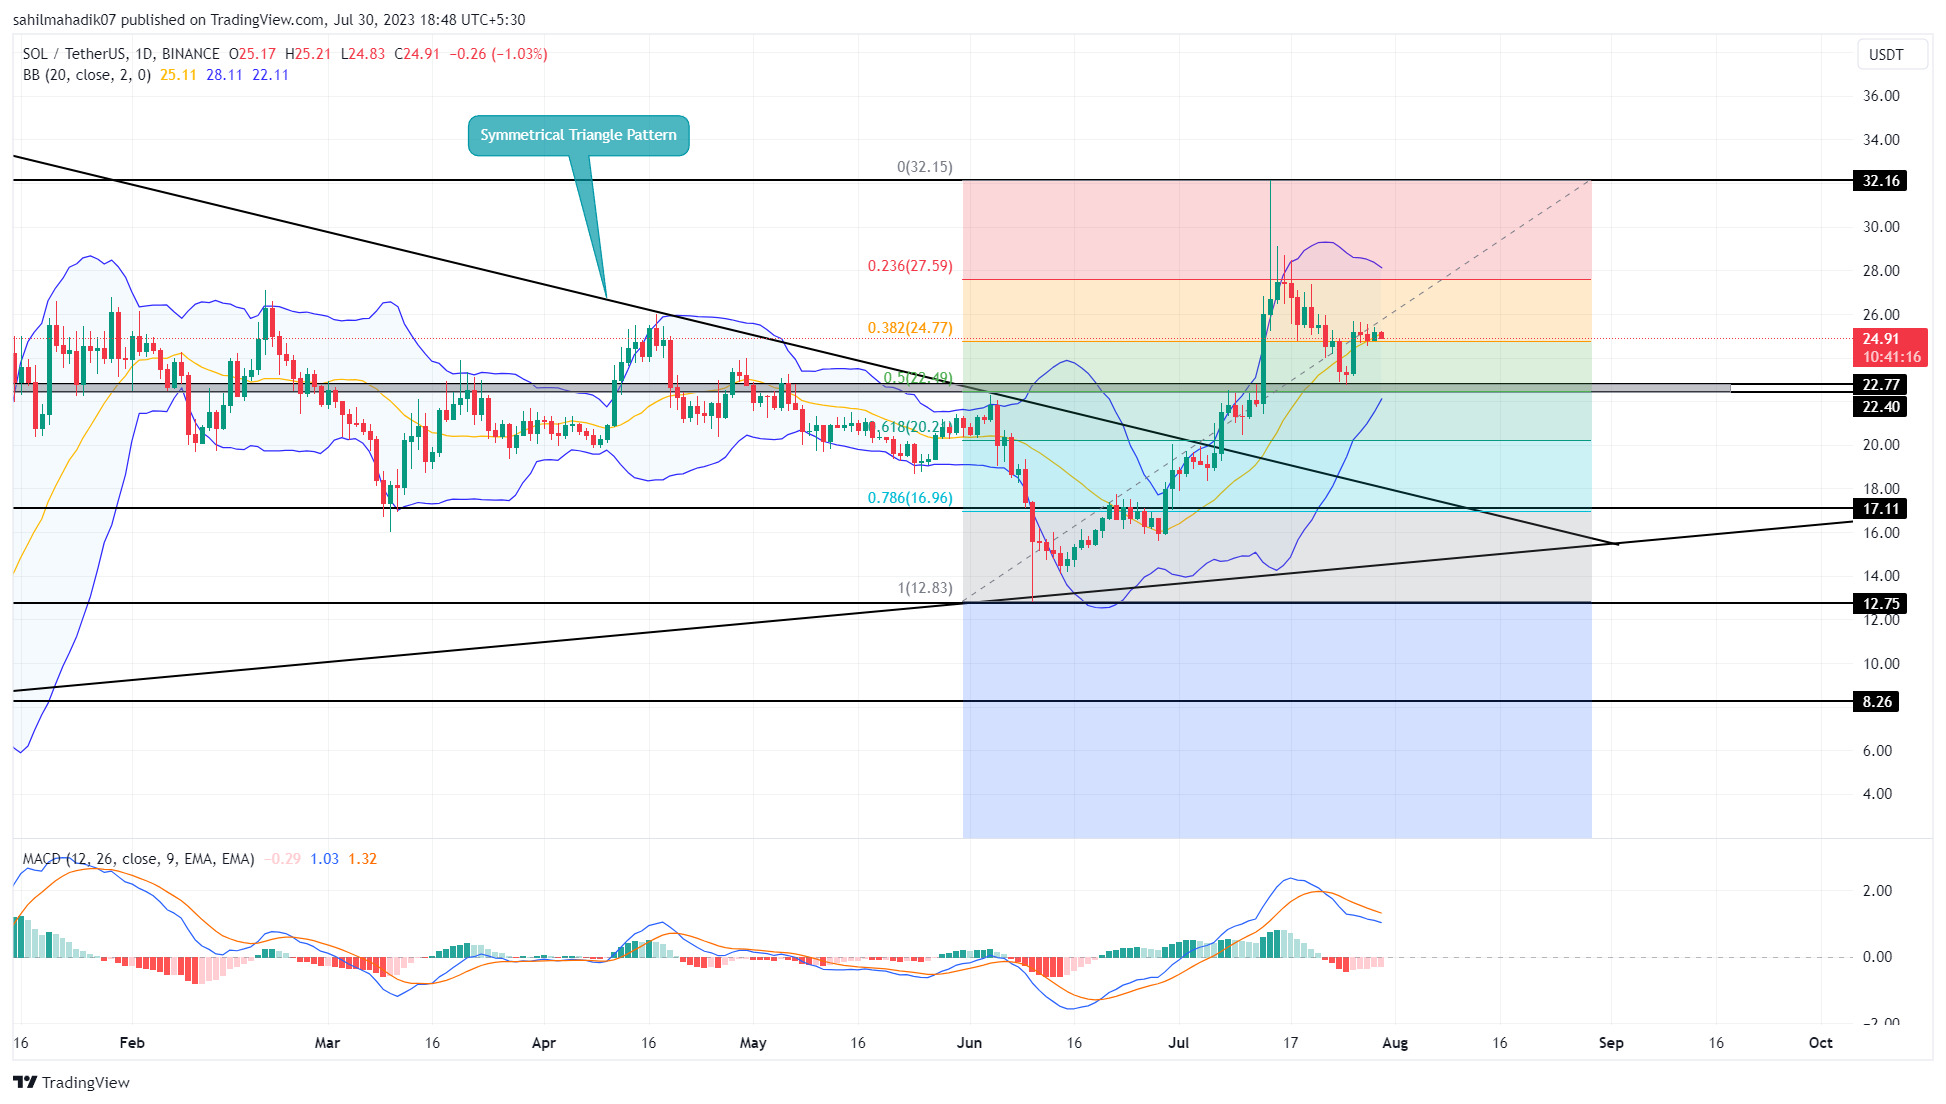
Solana (SOL), which is among the top altcoins in the list, entered a downtrend after reaching the resistance level of $32.1. The two-week downtrend has caused a 29% decrease in the market value of the altcoin and a drop to the $22.7 support level. The $22.7 level, which is in line with several technical indicators, indicates a strong accumulation zone for buyers.
Solana Price Analysis
The declining Solana price found support at $22.7, which is in line with the 50% Fibonacci retracement level and the 200-day EMA. In addition, a correction to the 50% Fibonacci level is considered a healthy retracement to increase buying pressure. The price of the altcoin recovered from the $22.7 support with a morning star candlestick formation on July 26, which is a leading sign for the continuation of the uptrend, and reversed the downtrend, increasing by 11.2% to $25.68.

The trend following this price movement turned towards some weakness in the uptrend momentum without providing a suitable follow-up that indicates sensitivity to the bearish market pressure. The ongoing bearish sentiment may continue to put pressure on buyers, causing the Solana price to stay above the $22.7 support for a few more trading days and create enough upward momentum.
According to CoinMarketCap data, Solana traded at $24.52, down 1.89% in the last 24 hours.
Can Solana Price Break the $32 Barrier?
According to technical analysis, for further confirmation of the SOL price’s upward movement, buyers need to make a daily candlestick close above the morning star pattern at $25.68. Such a breakout would support bulls in triggering a 25.6% rally and pushing the price to $32.1.
The ongoing recovery rally in the price is also supported by the breakout of the symmetrical triangle formation. According to this chart pattern, the SOL price could rise to the $39.2 to $40 range under strong bullish conditions.
The Moving Average Convergence Divergence (MACD) indicator on the Solana price chart reflects the presence of a downtrend as the MACD line (blue) dipped below the signal line (orange), indicating that the correction phase has not yet ended. However, the decrease from the peak of the Bollinger Band (BB) indicator suggests that rising prices could face additional resistance.

 Türkçe
 Español


