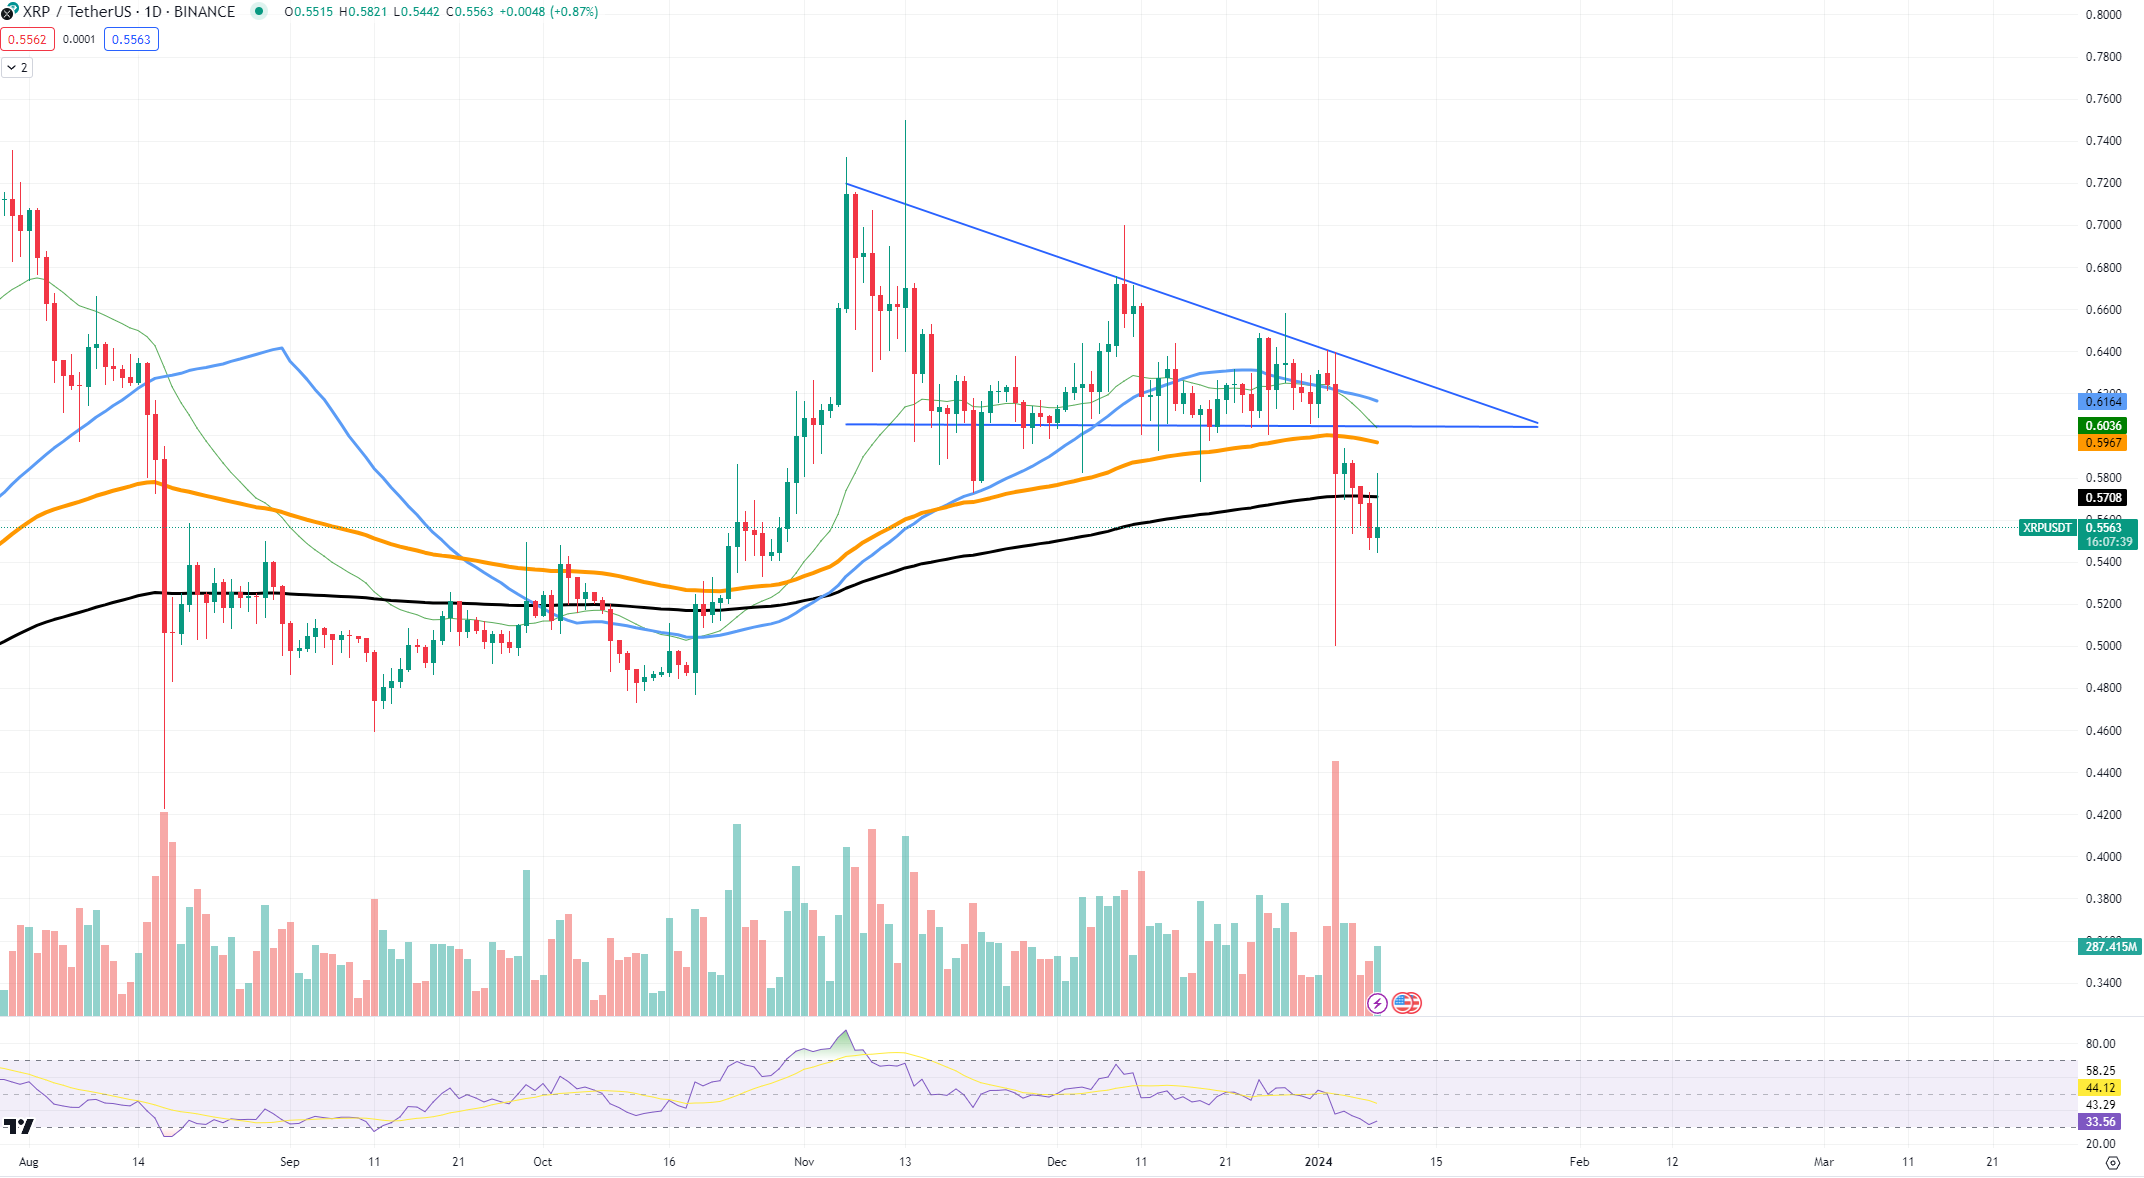
Graphic formations and technical indicators are often seen as harbingers of future price movements of an asset. Recently, an important candlestick formation, which could indicate a trend reversal, has formed around the $0.57 price level on the XRP/USDT chart for XRP, an altcoin that has not shown significant movement in the market lately.
The Hammer Formation in XRP’s Chart Winks at Investors
The mentioned candlestick formation, known as a “Hammer,” is characterized by a long lower wick and a small upper body. This indicates that despite selling pressure, buyers have started to step in, pushing the price back up and closing near the opening of the candle. Typically, such a candlestick formation is considered a significant bullish signal, especially when it appears at a known support level or after a price decline.

The Hammer Formation in XRP appeared after a selling period and indicates that the $0.57 level could be a potential turning point for the altcoin. This price level is critical as it represents a region where buyers have historically shown interest, and it now points to a possible reversal of the downtrend.
The First Critical Threshold for Altcoin is $0.63
It can be said that the first upward resistance level for XRP is around $0.63. This level has previously acted as a barrier for the asset, and attempts to break through have met with resistance. What is needed for a potential breakout scenario is a strong volume increase fueled by positive sentiment or news in the XRP market.
The Hammer Formation offers a sign of optimism that bears may be losing their grip. If this formation is confirmed, works, and buying increases, XRP’s price could rise beyond the $0.57 bottom level towards local resistance. A break above this resistance would further validate the reversal formation and potentially result in the emergence of a new uptrend.
However, it is noticeable that XRP is still in a downtrend. This suggests that investors should closely follow and assess the price movements of the altcoin.

 Türkçe
 Español


