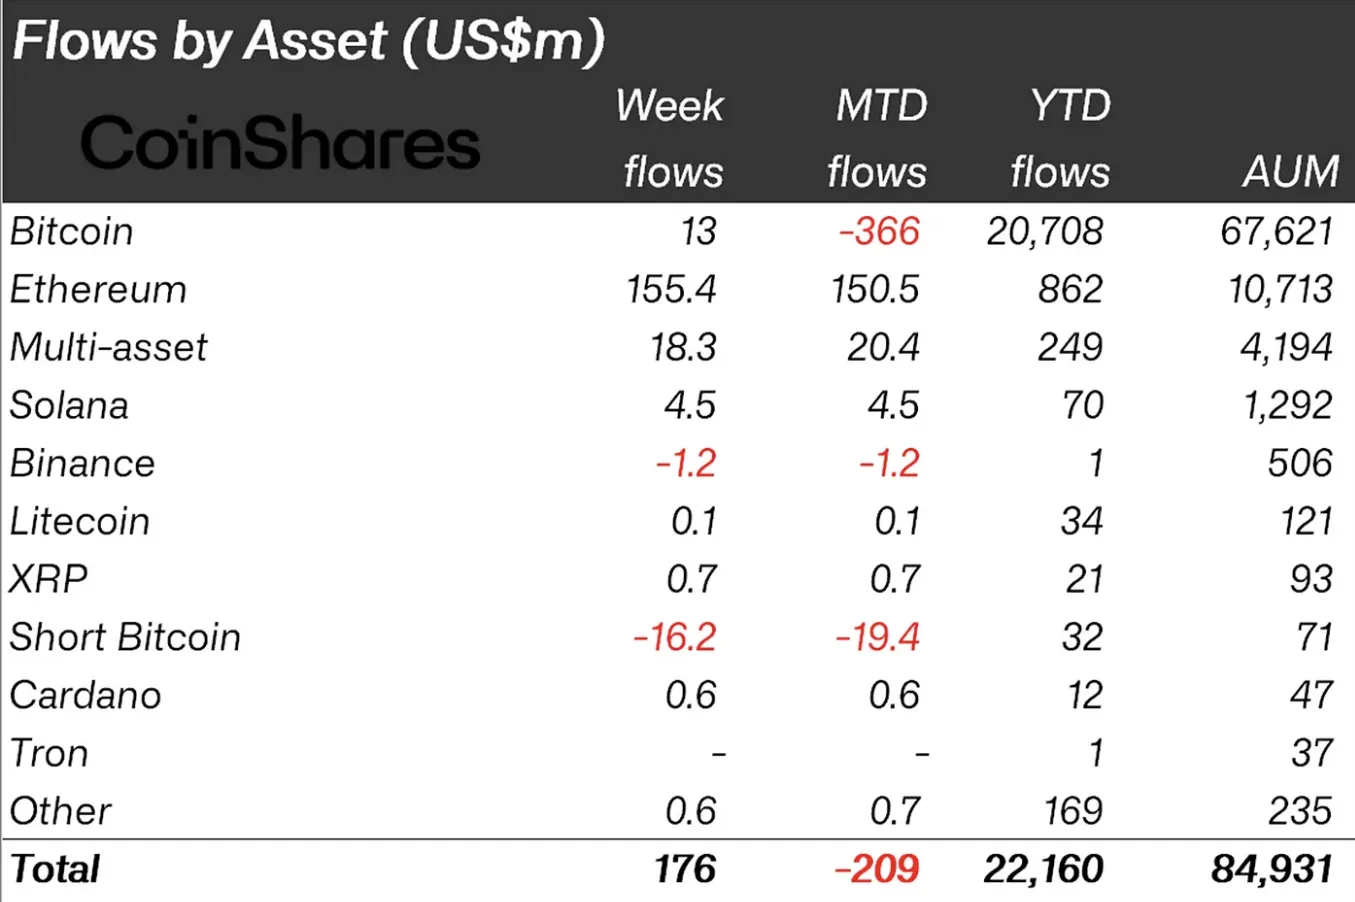
Unlike the previous period, crypto investment products closed last week with a net positive flow, but Binance Coin (BNB) did not show the same trend. This development raises concerns about the token’s short-term potential and highlights a scenario where BNB’s price might decrease. According to CoinShares’ latest report, crypto asset investment products saw an inflow of $176 million.
What is Happening with BNB?
This increase indicates that investors saw the crash on August 5th as an opportunity to accumulate at discounted prices. Bitcoin (BTC), Ethereum (ETH), and Solana (SOL) saw significant inflows, while BNB was the only top 5 token to experience outflows. Specifically, Binance Coin recorded a total outflow of $1.2 million. This decline could be linked to BNB’s price movement. During the sudden selling pressure, the token’s value dropped to $404.30, causing panic among investors and spreading doubts about the cryptocurrency’s potential.

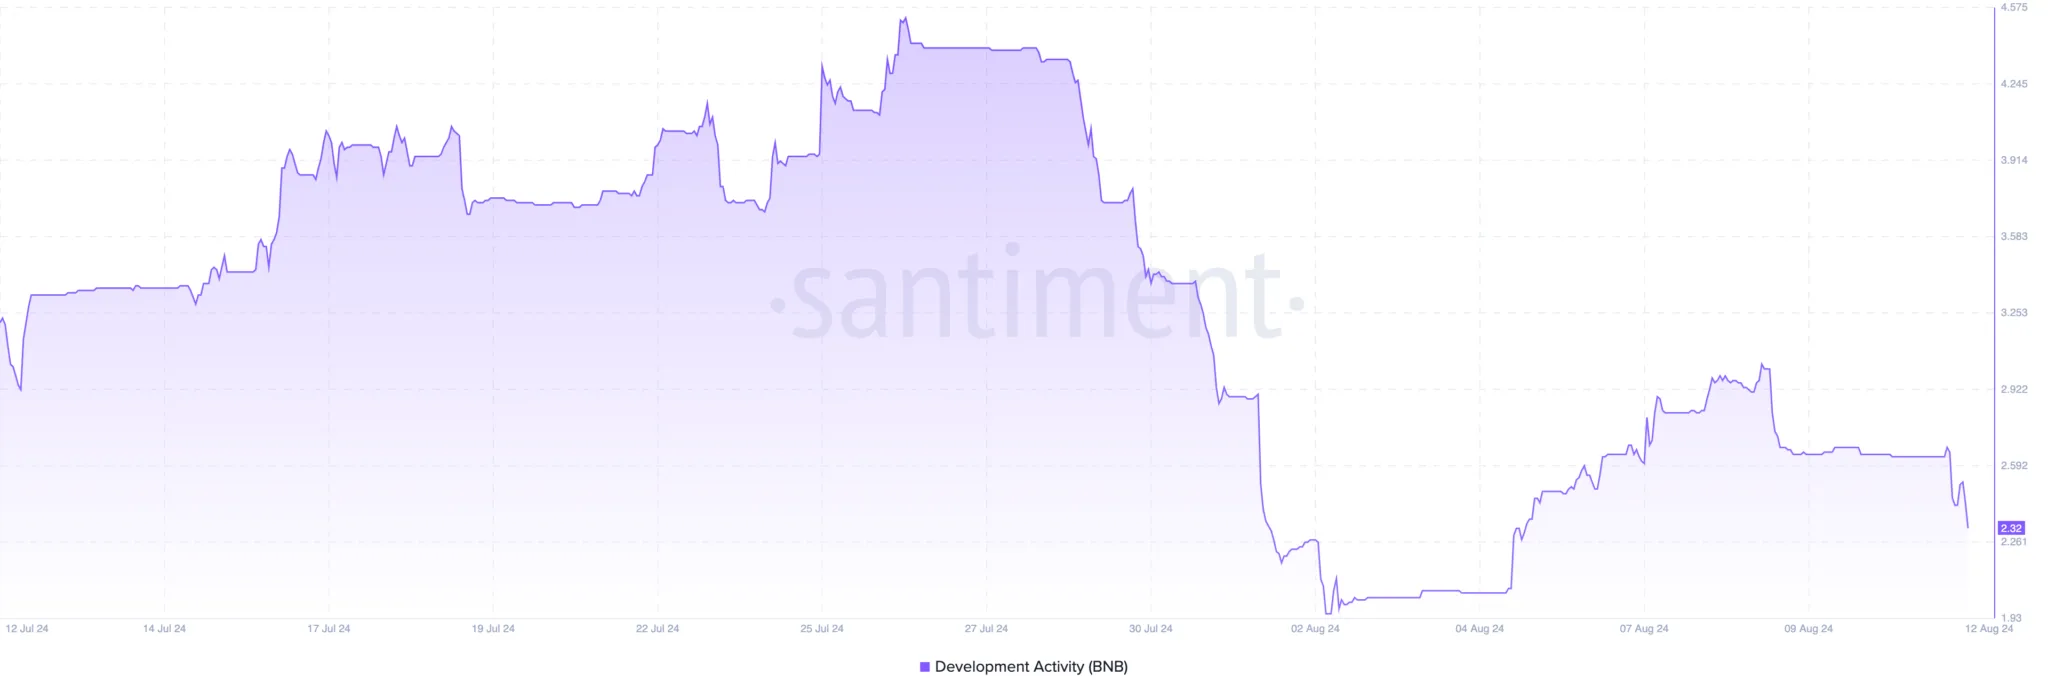
This sentiment sharply contrasts with the optimism seen when BNB reached $701 in June. Currently, the altcoin is trading at $508, marking a 5.06% decline from its recent peak of $535 on August 11th. In addition to the price drop, the BNB ecosystem is experiencing a significant decline in development activity, a crucial metric for assessing the health and valuation of a blockchain network.
This data shows whether a project is experiencing growth and smart contract deployment. An increase in development activity indicates that developers are introducing new features that could potentially boost user adoption of the blockchain network.

BNB Chart Analysis
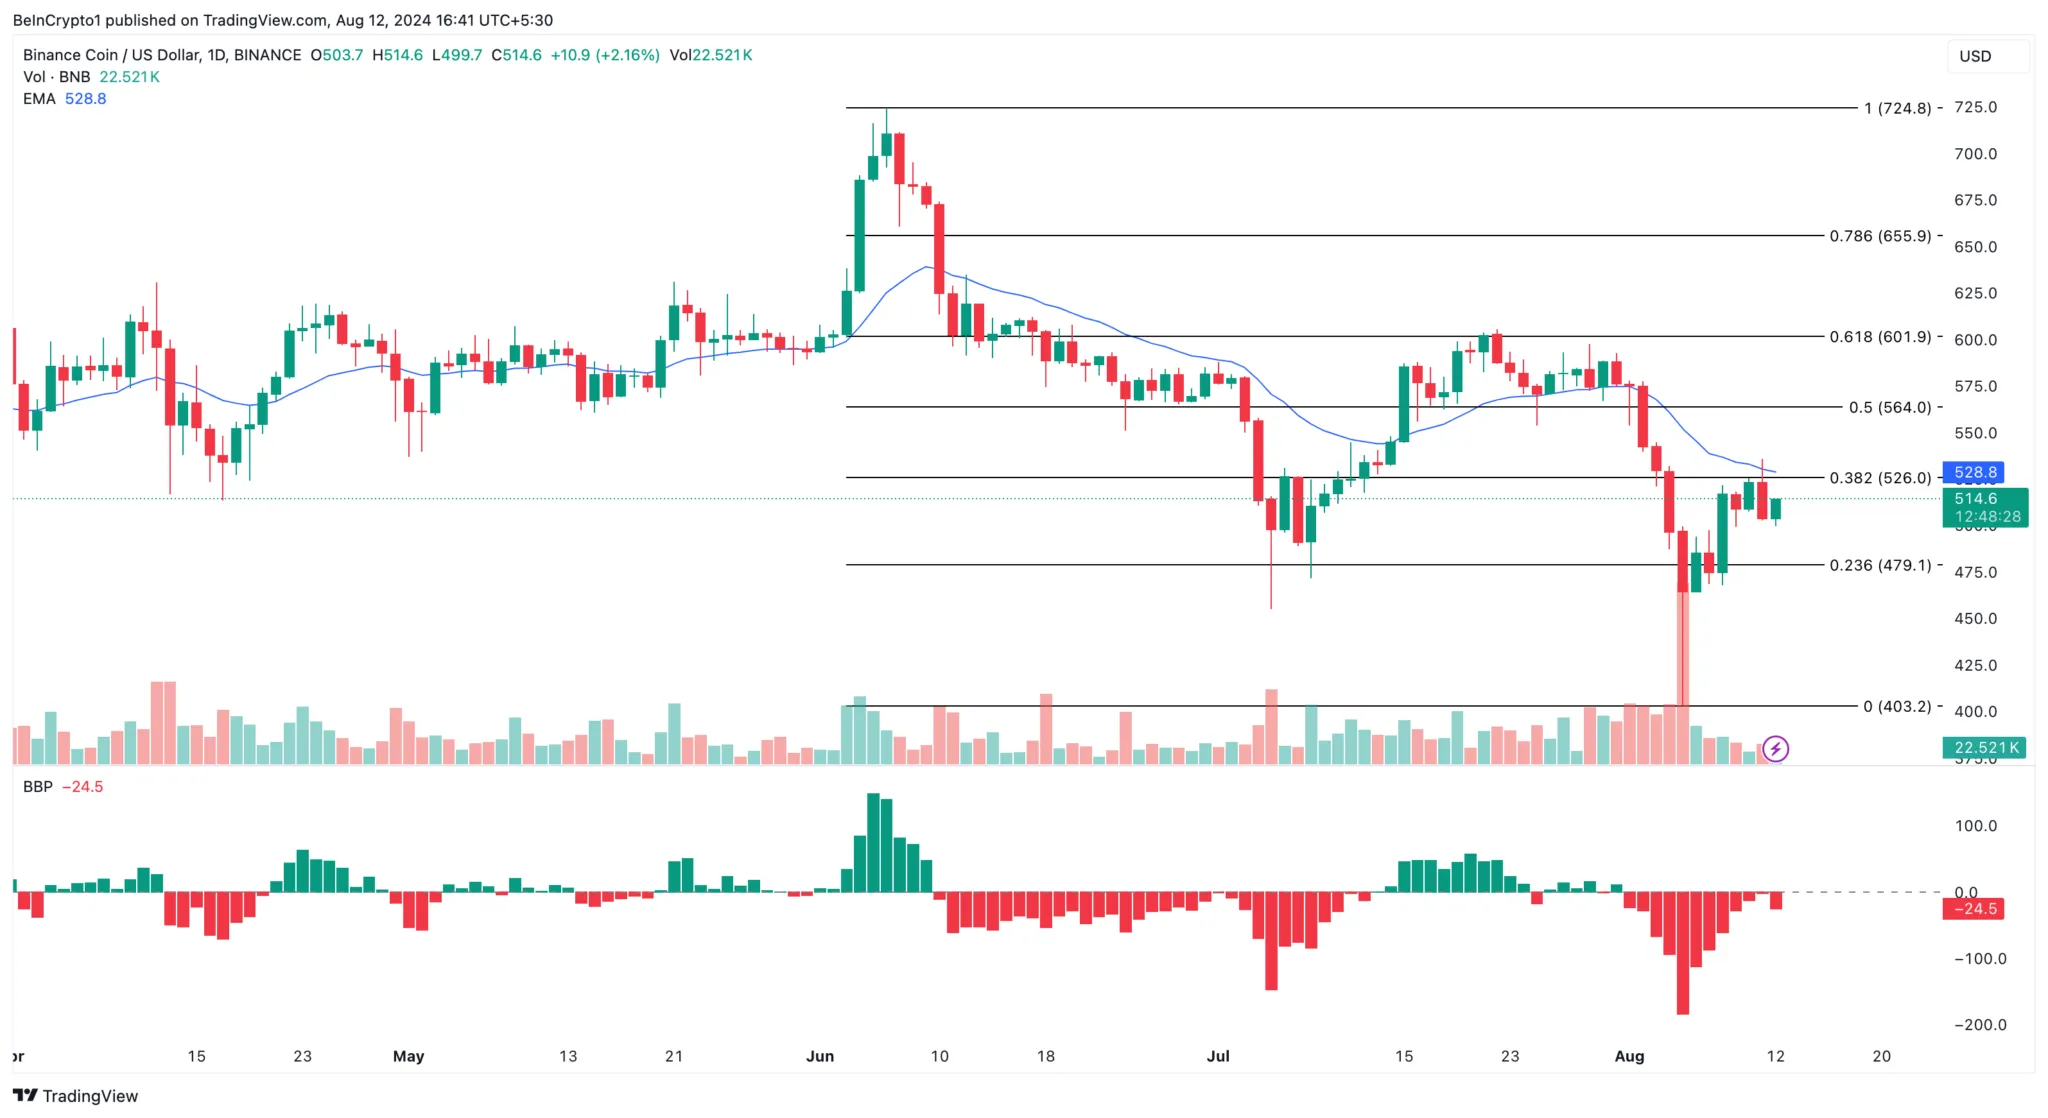
According to Bull Bear Power (BBP), bears still determine the direction of BNB. Also known as the Elder Force Index, BBP measures the strength of buyers and sellers by comparing low and high swings with the Exponential Moving Average (EMA). When the BBP reading is positive, bulls are in control, and the price may rise. A negative reading means BNB’s price is likely to fall.
Additionally, the token’s price is below the 20-day EMA, as it was a few weeks ago. Simply put, the EMA measures the trend direction over a specific period. If the price is above the indicator, the trend is bullish. Therefore, the current position indicates that BNB is in a downtrend. Assuming this remains the same, BNB’s price could drop to $479.10. However, if bulls regain control from bears, the token’s value could rise to $526.


