ETH Coin, held by a significant portion of long-term investors, has a promising future. Its negative inflation and active blockchain contribute positively to its future. Even today, many popular layer1 solutions are moving towards becoming Ethereum layer2 solutions in order to survive.
Current Status of Ethereum (ETH)
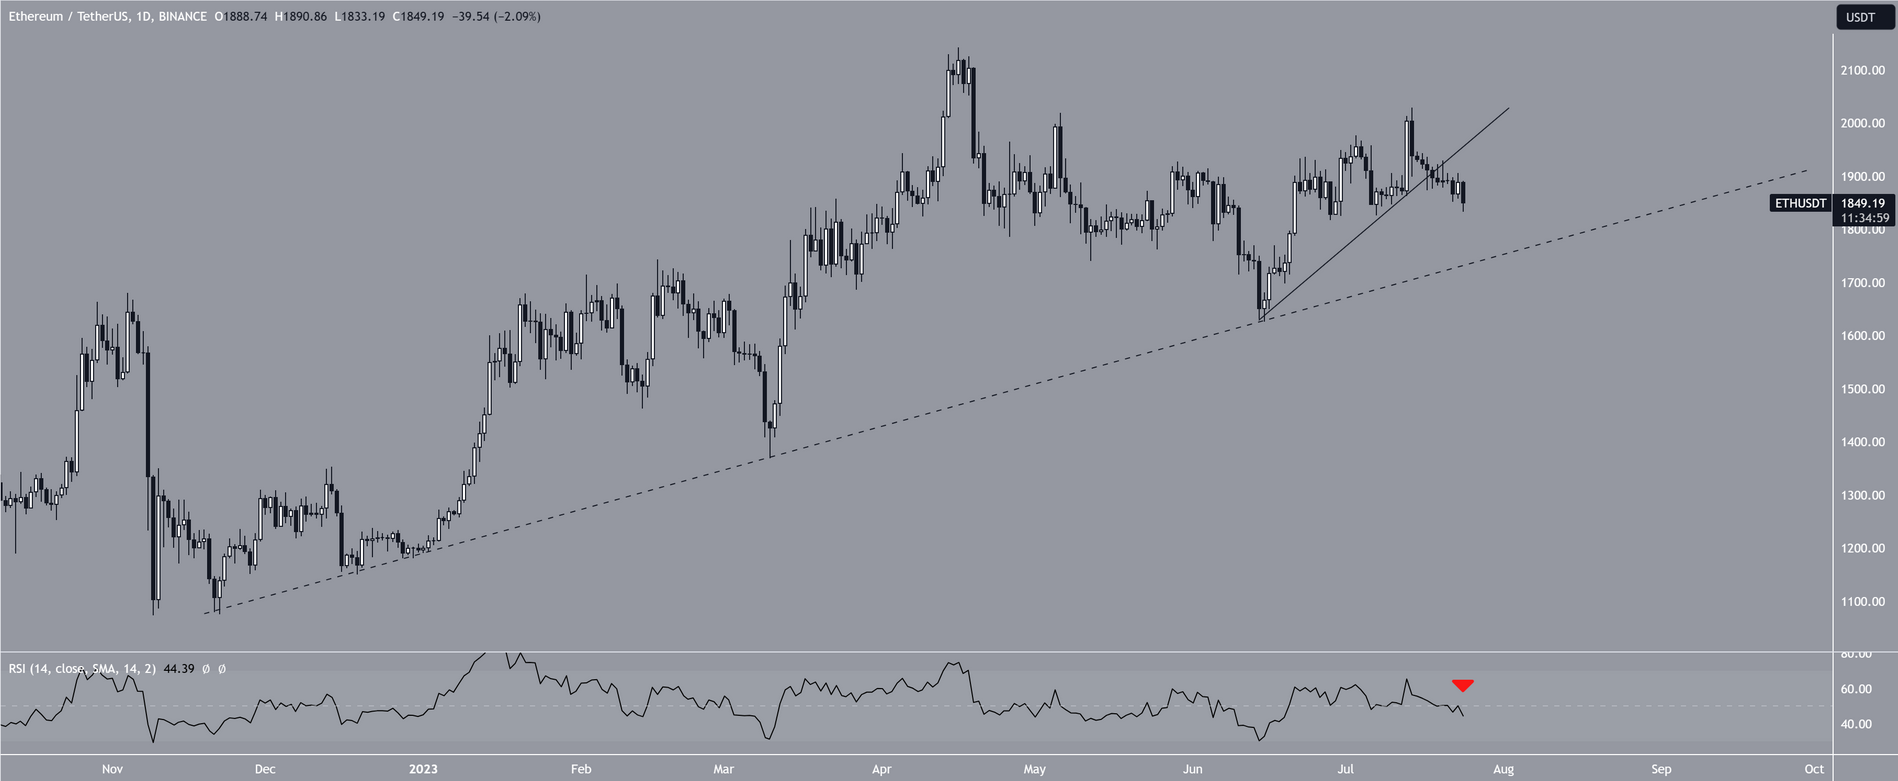
Ethereum (ETH) price has been declining since reaching its highest level of the year on July 14. The downward movement confirms that the price of ETH has initiated a significant correction by breaking away from an upward support line. The wave count indicates that a bottom will soon be reached, after which the ETH price will likely continue its upward trend.

The daily timeframe technical analysis for Ethereum price provides mixed signals. This is due to the price movement and technical indicators. Since June 10, the ETH price and the rising support line have been increasing. As long as the line remains intact, the trend can be considered bullish. However, the ETH price has been declining since July 14 and broke the line six days later. This is a sign that the previous upward movement has ended and a new downward movement has begun.
Ethereum (ETH) Price Chart
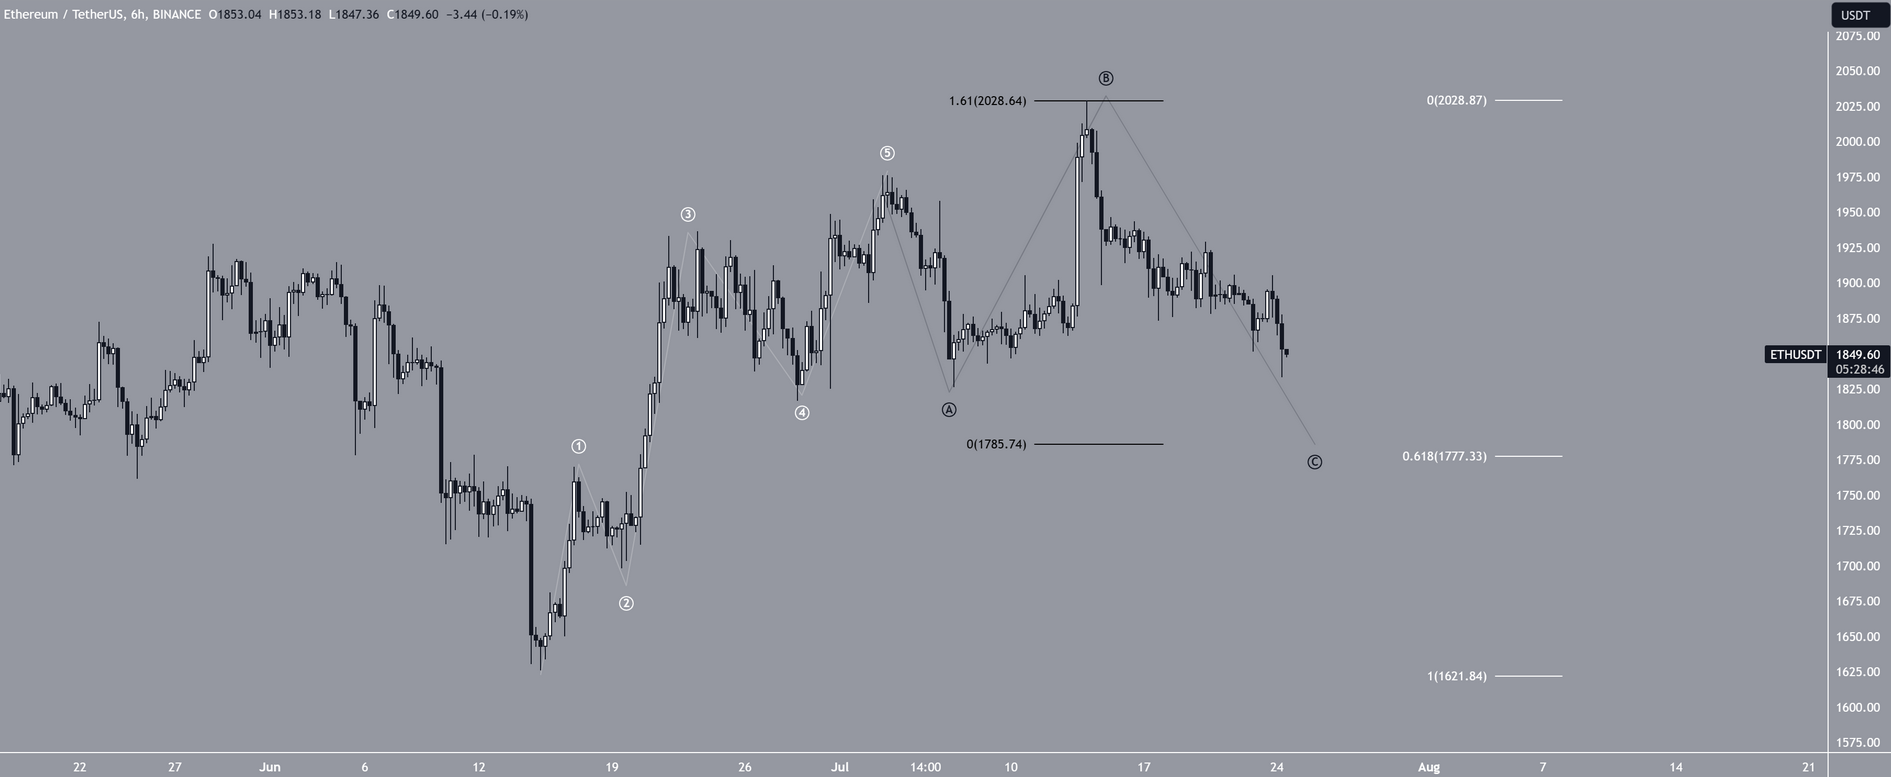
The daily RSI is in a downward trend, legitimizing the decrease in Ethereum price. The six-hour chart also supports the legitimacy of the breakout. However, it also indicates that the downward movement will soon come to an end. According to the Elliot Wave count, the ETH price has completed a five-wave uptrend and is currently stuck in an A-B-C corrective structure. If that’s the case, it is currently in the C wave, which will complete the correction.

Elliot suggests that after testing the bottom at $1,780, an upward movement towards $2,000 will begin. Despite the long-term bullish ETH price prediction, if the price falls below $1,648, which is the lowest level since June 10, it may invalidate the prediction.
Possible consecutive declines may cause the king of altcoins to drop to $1,450. At the time of writing, ETH is trading at $1,857.


