The cryptocurrency market continues to experience significant developments led by Bitcoin. Lately, user initiatives in blockchain such as airdrop events and memecoin projects have accelerated the momentum of many altcoin projects. What can we expect from the fronts of Solana, Ripple, and Avax during this process? We examine with detailed chart analysis.
Solana Chart Analysis
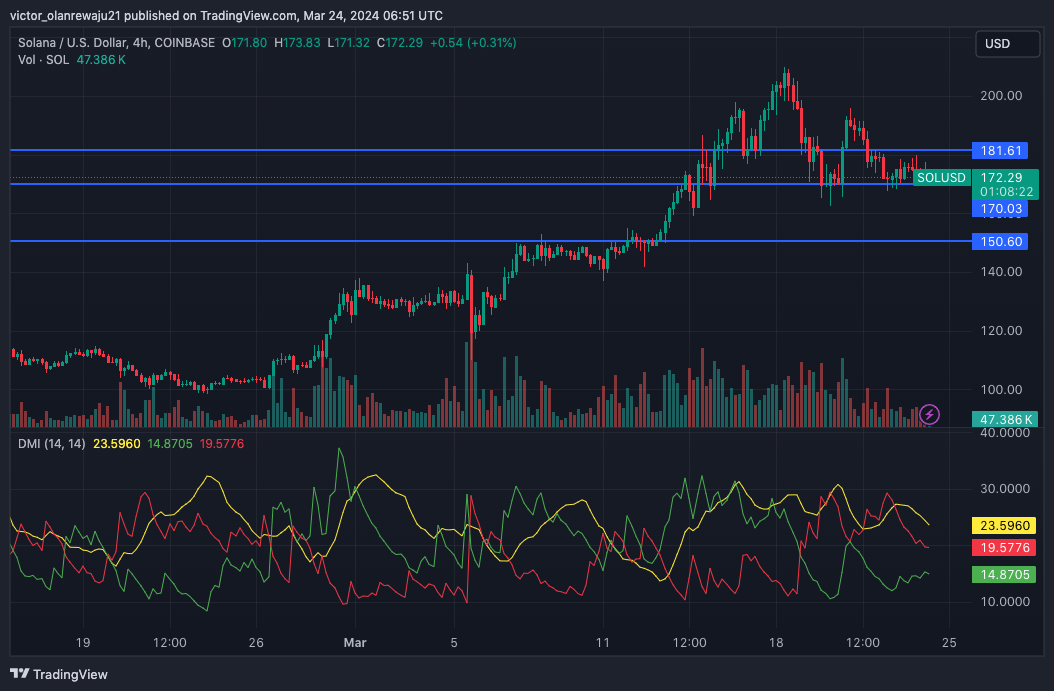
Solana erased a large portion of its previous gains with the recent correction. However, the four-hour SOL/USD chart showed how determined the bulls are to defend the price movement at the $170.03 level. Establishing support at this level could prevent the price from falling to $150.60.
On the upside, resistance is at the $181.61 level. Breaking this resistance could allow the SOL price to retest the peaks it reached on March 18. If the bears thwart these attempts, Solana’s price could fall below $160. Crypto Traders Are Rushing to This App – Here’s Why You Should Too

Ripple Chart Analysis
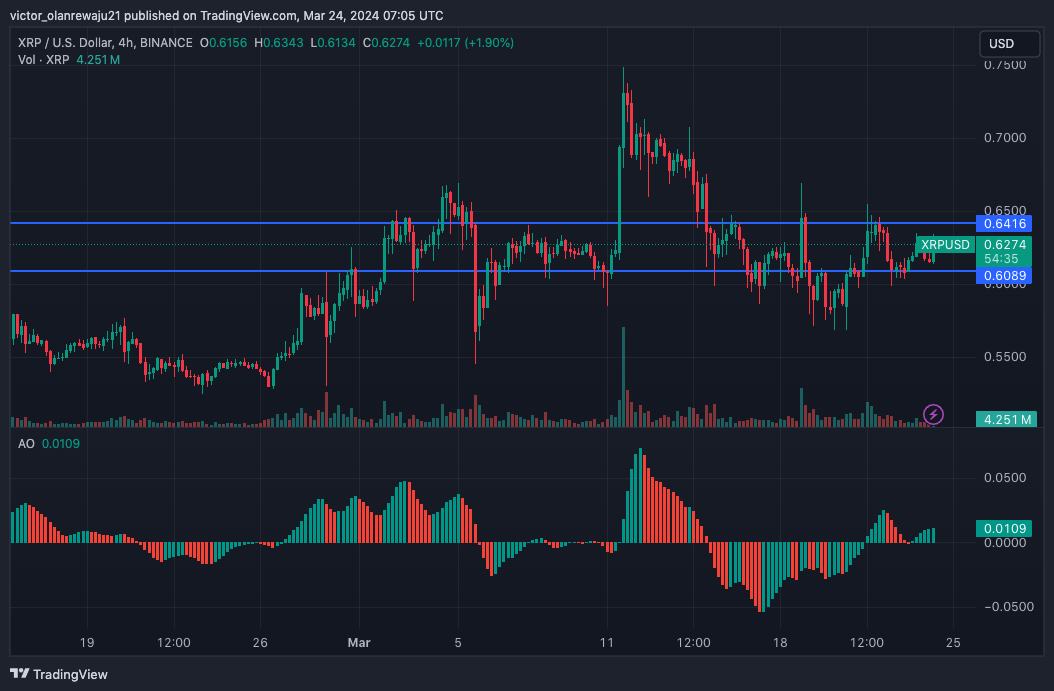
XRP, is another cryptocurrency project showing more signs of an uptrend than a downtrend. On March 23, the Ripple price dropped to $0.60, but the bulls came to XRP’s rescue, pushing the price up to $0.62. Indicators from the Awesome Oscillator (AO) data reflect an increasing upward momentum. If this continues, XRP’s price could climb to $0.64.
However, Ripple could encounter resistance at this point. Rejection at the $0.64 level could pull the XRP price below $0.60. A successful close above this could help Ripple approach $0.70.

Avax Chart Analysis
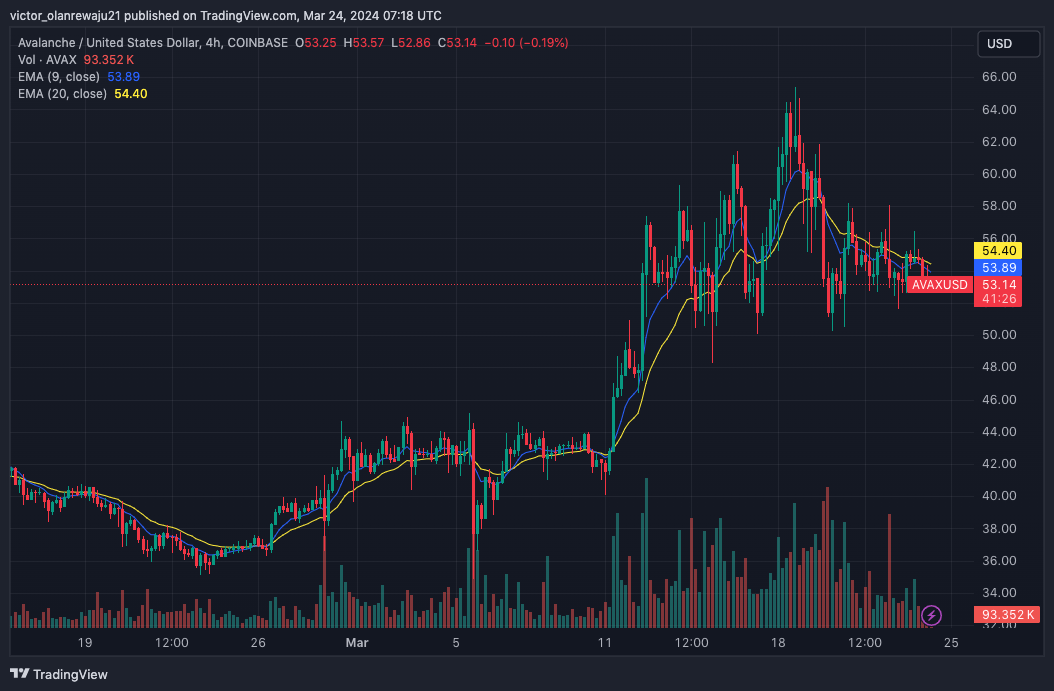
Avax reaching a price of $65.45 led to predictions that the price could hit $100 in a short time. However, Avax’s recent trading price of $53.11 has halted this momentum. At the time of writing, the EMA 9 level (blue) is at $53.90, while the EMA 20 (yellow) is at $54.40. Especially since AVAX is trading below both points, this trend indicates a downward trajectory.
Failing to rise above the short-term EMA levels could lead to further correction in AVAX’s price, potentially dropping to $47.64. From an uptrend perspective, the token value may attempt to retest $57.01.


 Türkçe
 Español


