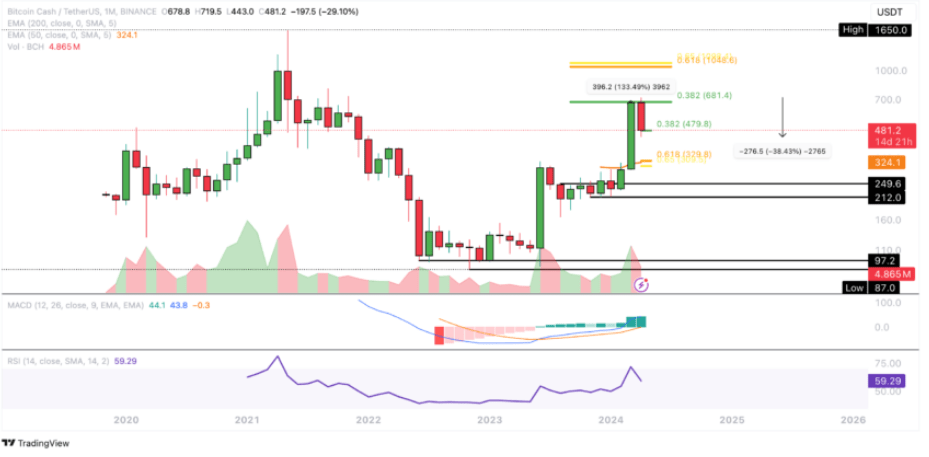
Last month, Bitcoin Cash (BCH) price reached $681, marking an increase of over 133%. However, this level faced a downward rejection. Currently, Bitcoin Cash is undergoing a corrective movement this month, and the duration of this correction remains uncertain. What should we expect for BCH prices moving forward?
Pay Attention to These Levels in BCH Price
BCH price is currently experiencing a correction of over 38% and is facing significant Fibonacci support around $480. If this support weakens, another important support level lies around $325, with the 50-month EMA providing additional support.
When examining the monthly chart, the Moving Average Convergence Divergence (MACD) histogram shows an upward trend, while the Relative Strength Index (RSI) displays a neutral stance.

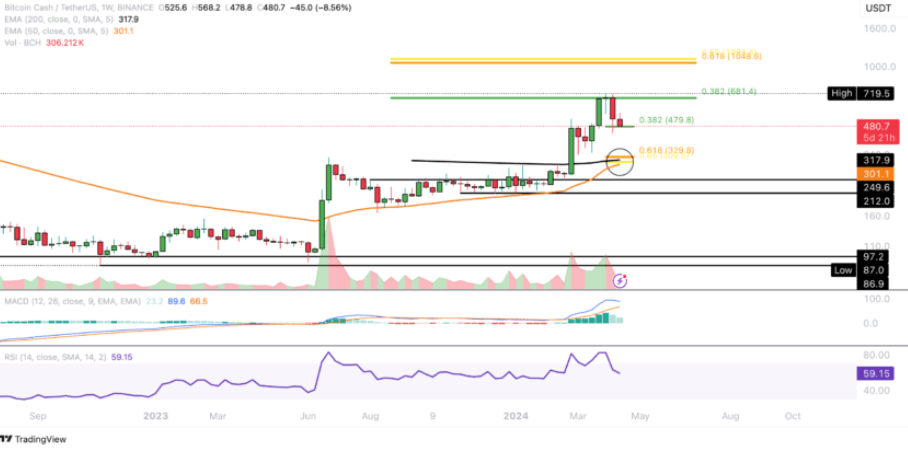
Looking at the weekly chart, there is potential for a golden cross indicating a mid-term upward trend in the EMAs. Although the MACD histogram is in a downtrend, the MACD lines have shifted upward.
Focus on These Levels if Uptrend Occurs
The RSI is currently in a neutral zone. Bitcoin Cash promises a recovery from the $480 level, which corresponds to the 0.382 Fibonacci support. Subsequently, BCH may attempt to surpass the 0.382 Fibonacci resistance around $681.4. A successful breakout could pave the way to the next target around $1,050. Surpassing the golden ratio at $1,050 could signify a new upward cycle for the cryptocurrency.

If Bitcoin Cash breaks current support levels, significant support is expected around the $325 Golden Ratio, with additional reinforcement just below $340 provided by the 200-day EMA.
Possibility of a Death Cross
In the 4-hour chart of Bitcoin Cash, there is a possibility of a death cross formation that could solidify a short-term downtrend. Additionally, while the MACD histogram indicates a decline in momentum, the RSI remains in the neutral zone without giving any directional signals.
In comparison to BTC, Bitcoin Cash faced a downward rejection in the resistance zone stretching from 0.00999 BTC to 0.0108 BTC. BCH price encounters significant Fibonacci supports around 0.0079 BTC and 0.0062 BTC. While MACD lines on the monthly chart continue an upward trend, the MACD histogram this month shows a downtrend with a neutral RSI.

 Türkçe
 Español


