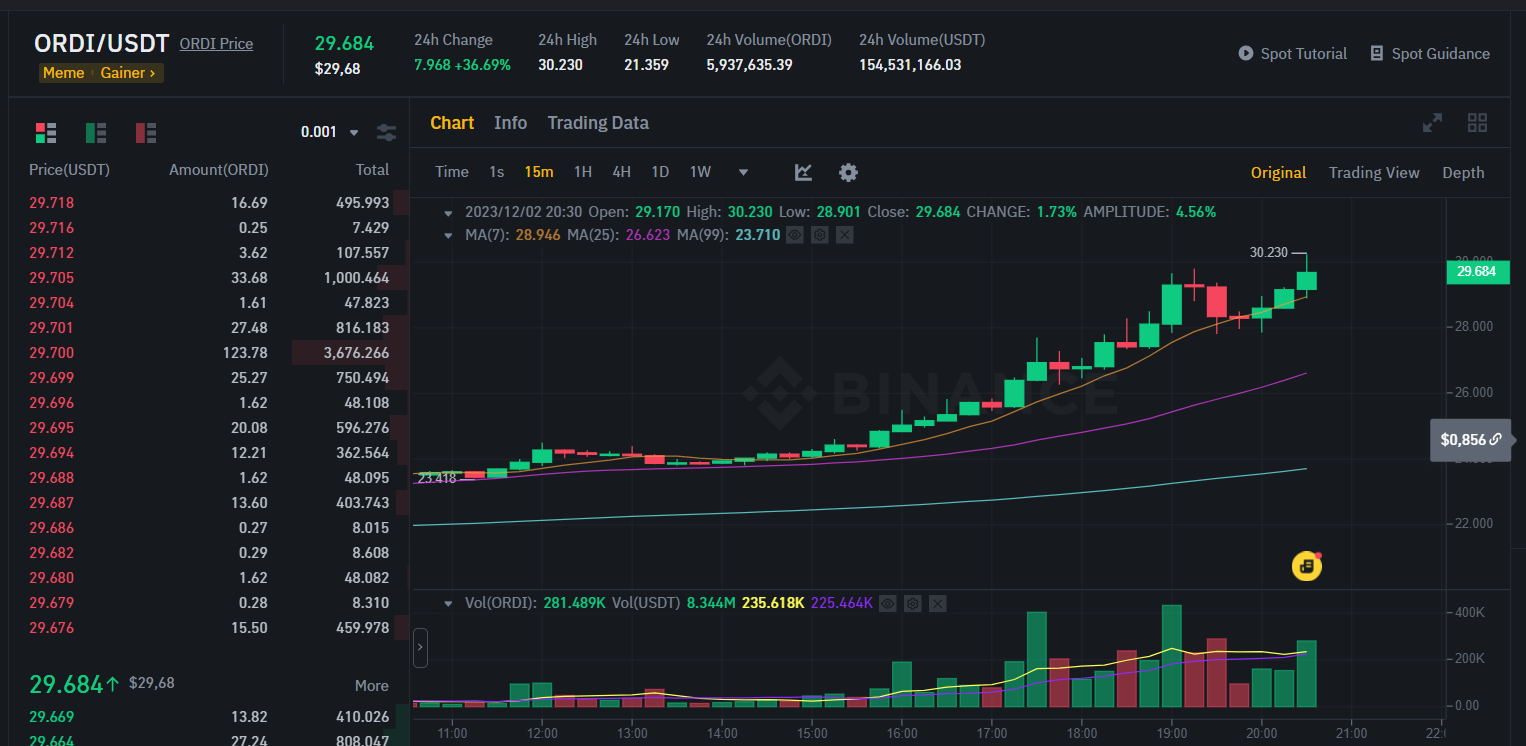
In the dynamic world of cryptocurrencies, Ordinals (ORDI) has recently stood out with an impressive market performance. Meticulous analysis reveals that ORDI’s price movements are in line with the golden ratio per Fibonacci retracement. This positioning often indicates a potential price jump.
Bullish Wave Elevates ORDI to the Most Profitable Position
ORDI experienced a significant upward momentum, surpassing its counterparts in the past 24 hours. Starting from its lowest point of $21.01, it reached an all-time high of $30.23, attracting attention in the cryptocurrency world. This notable upward trend caught the attention of both investors and traders.

Critical technical indicators further enhance confidence in ORDI’s potential. The Relative Strength Index (RSI) and the MACD metric on the 4-hour chart show positive trends. With RSI at 90.24, it signals an overbought condition that could precede a pullback, while the positive momentum from the MACD metric indicates continued buyer interest and price growth.
Market Structure Indicates an Imminent Breakout
Examining ORDI’s market structure adds another layer to the bullish sentiment. The asset consistently records higher lows. This formation typically precedes a breakout from the dominant trendline, followed by the formation of a higher peak. This formation underscores strong upward momentum and serves as a crucial factor for strategic planning among traders.
Recent price movements on the hourly chart have proven advantageous for strategic investors. Confirming a trendline breakout has provided an attractive entry point that strategically capitalizes on recent high volatility.
This strategic move highlights the importance of timely market entry and exit strategies to maximize returns in the ever-evolving cryptocurrency landscape.


 Türkçe
 Español


