This week has been a positive one for cryptocurrency investors. The challenging market conditions caused by recent geopolitical issues and US macroeconomic data have been left behind with positive news flow. So, what’s happening with Polygon (MATIC) that crypto investors are eagerly following as everyone prepares for the week’s closing hours? Let’s take a closer look.
MATIC Chart Analysis
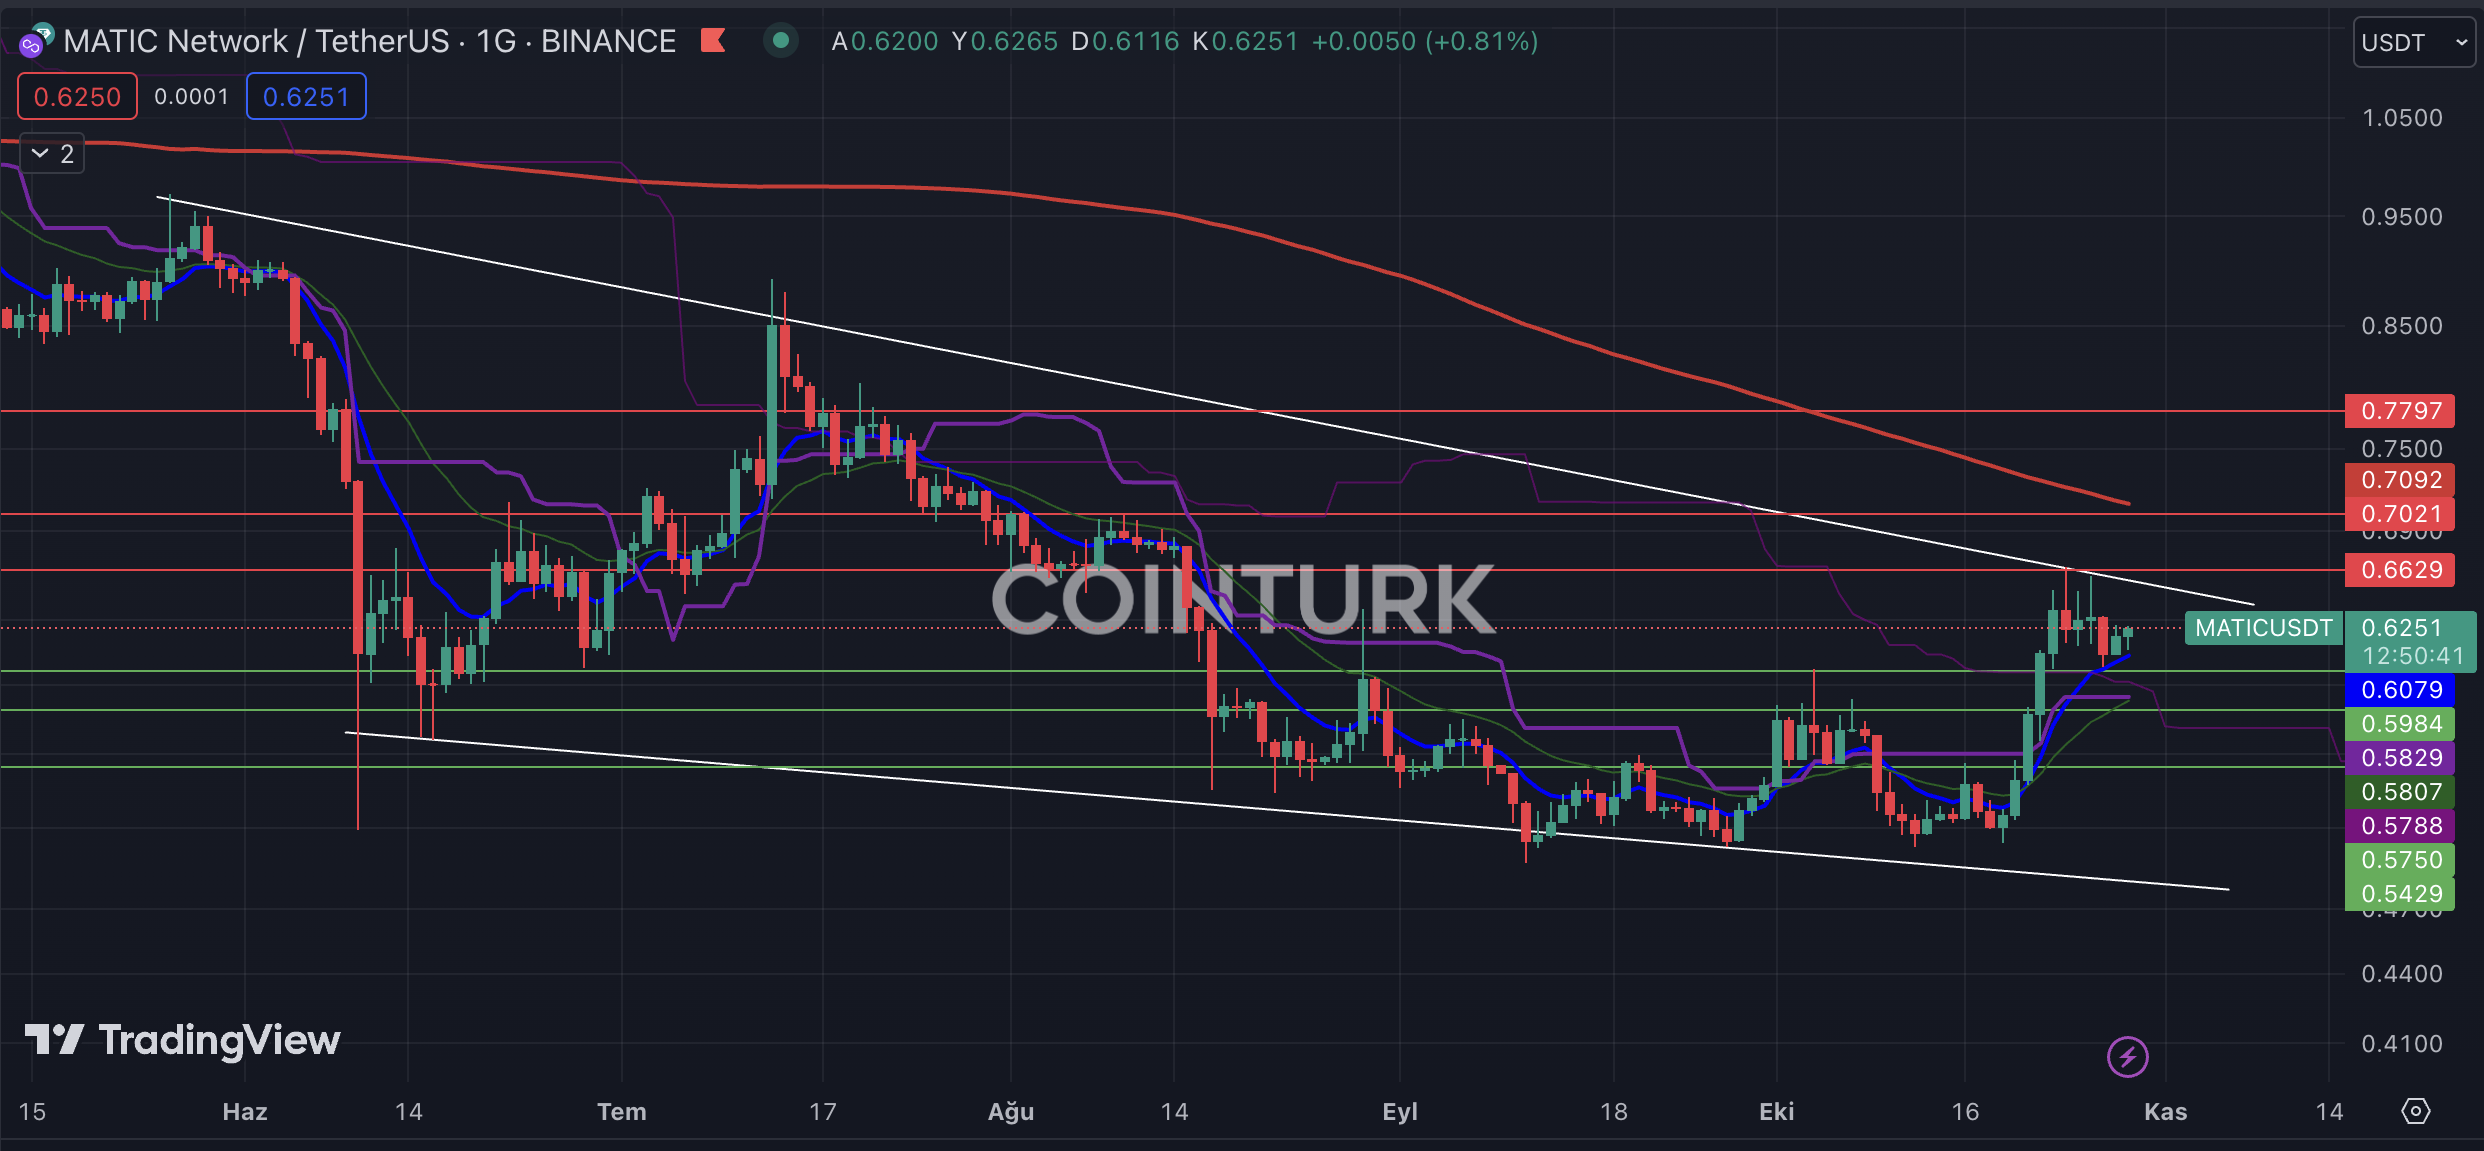
The first notable formation on the daily MATIC chart is a descending triangle pattern. According to this structure, the price of MATIC, which follows this pattern, has faced resistance once again in recent bar closures, which could cause the price to drop. The first move that needs to be seen for MATIC, which continues to trade above the EMA 7 and EMA 21 levels, is a breakout of resistance. Such a move would enable an acceleration in the price’s upward momentum.
The support levels to watch for MATIC are as follows: $0.5984, $0.5750, and $0.5429. In particular, a break below the $0.5429 level and a bar closure below this level would weaken the price below the support levels of EMA 7 and EMA 21 and also serve as the next formation support.
The resistance levels to monitor for MATIC are as follows: $0.6629, $0.7092, and $0.7797. In particular, the convergence of the EMA 200 level with the $0.7092 level highlights the importance of this level. If the daily bar closes above this level, it would indicate a breakout of the formation and an acceleration in the price’s upward momentum.

MATIC/ETH Pair Chart Analysis
The four-hour chart of the MATIC/ETH pair reveals an ascending channel formation. The dominance of the recent rise in Ethereum hinders the possibility of an upward movement in this chart. However, a breakout above the EMA 7 and EMA 21 levels in the near future could trigger a potential MATIC rally.
The support levels to watch for the MATIC/ETH pair are as follows: 0.0003472, 0.0003440, and 0.0003400. In particular, a bar closure below the significant level of 0.0003440 would weaken MATIC against Ethereum.
The resistance levels to pay attention to for the MATIC/ETH pair are as follows: 0.0003544, 0.0003581, and 0.0003645. In particular, a bar closure above the 0.0003544 level would allow us to see the highest level of the recent period in the pair.


