Türkçe
 Español
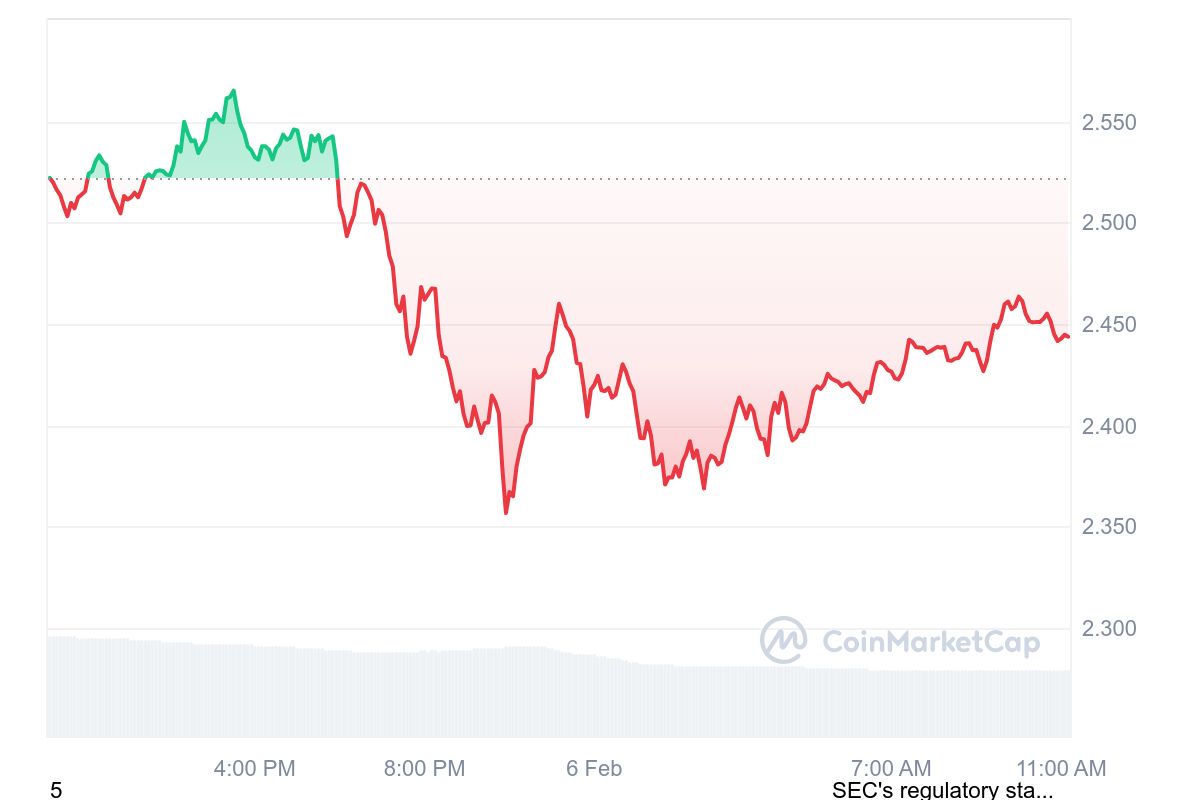
Ripple  $2‘s XRP is currently fluctuating at critical levels as of February 6. The price has experienced a decline of over 3% in the last 24 hours, testing the region below $2.50. XRP fell to as low as $2.36 in the same period, indicating potential movement towards resistance points at $2.50 and $2.70. Notably, XRP had dipped to $1.95 on February 3 but managed a rapid recovery.
XRP Price Analysis
Price analysis shows that XRP has historically received strong support at $2.50 and $2.70 levels. A decline exceeding 22% in the past week reflects market volatility. Furthermore, a breakdown below $1.95 could signal deeper price drops.

The long-term chart for XRP indicates that $1.20 is a critical support level, frequently tested following significant market sell-offs. If this level is maintained, it could provide promising movement opportunities for traders. Should prices stay above this threshold, targets could rise towards $4.20, $5, and $6.60. The analysis emphasizes the importance of sustaining these support levels in light of broader recovery efforts in the market.
Short-Term XRP Commentary
XRP’s current chart structure suggests a potential upward momentum in the short term. If the trend line and $2.57 level are surpassed, a breakout towards $3.40 may occur. However, sudden drops should be anticipated in the volatile market conditions. The existing price movements of XRP are characterized by critical breakout points that require cautious attention from traders.
Future price movements will dictate how traders approach market dynamics. The bullish expectations hinge on maintaining prices above $2.57. If critical support levels are sustained, reaching established target levels seems possible. XRP’s short-term performance is being closely monitored by traders.