In the Bitcoin ecosystem, the memecoin ORDI, which stood out during the recent Inscriptions hype and provided its investors with serious gains, has become one of the best-performing crypto assets of the last quarter of 2023 with a 2200% increase since October 16. ORDI reached its all-time high of $82.80 on December 26, but then experienced a slight decline.
ORDI’s Record-Breaking Performance Continues
ORDI’s price has continued to rise since September 11, accelerating significantly after creating a higher low on October 16. The upward movement is occurring in a parabolic manner without any significant price drop. After a consolidation that began on December 6, ORDI resumed its rise yesterday and reached its all-time high of $82.80 today. Since the start of the upward movement, ORDI’s price has increased by 2200%.
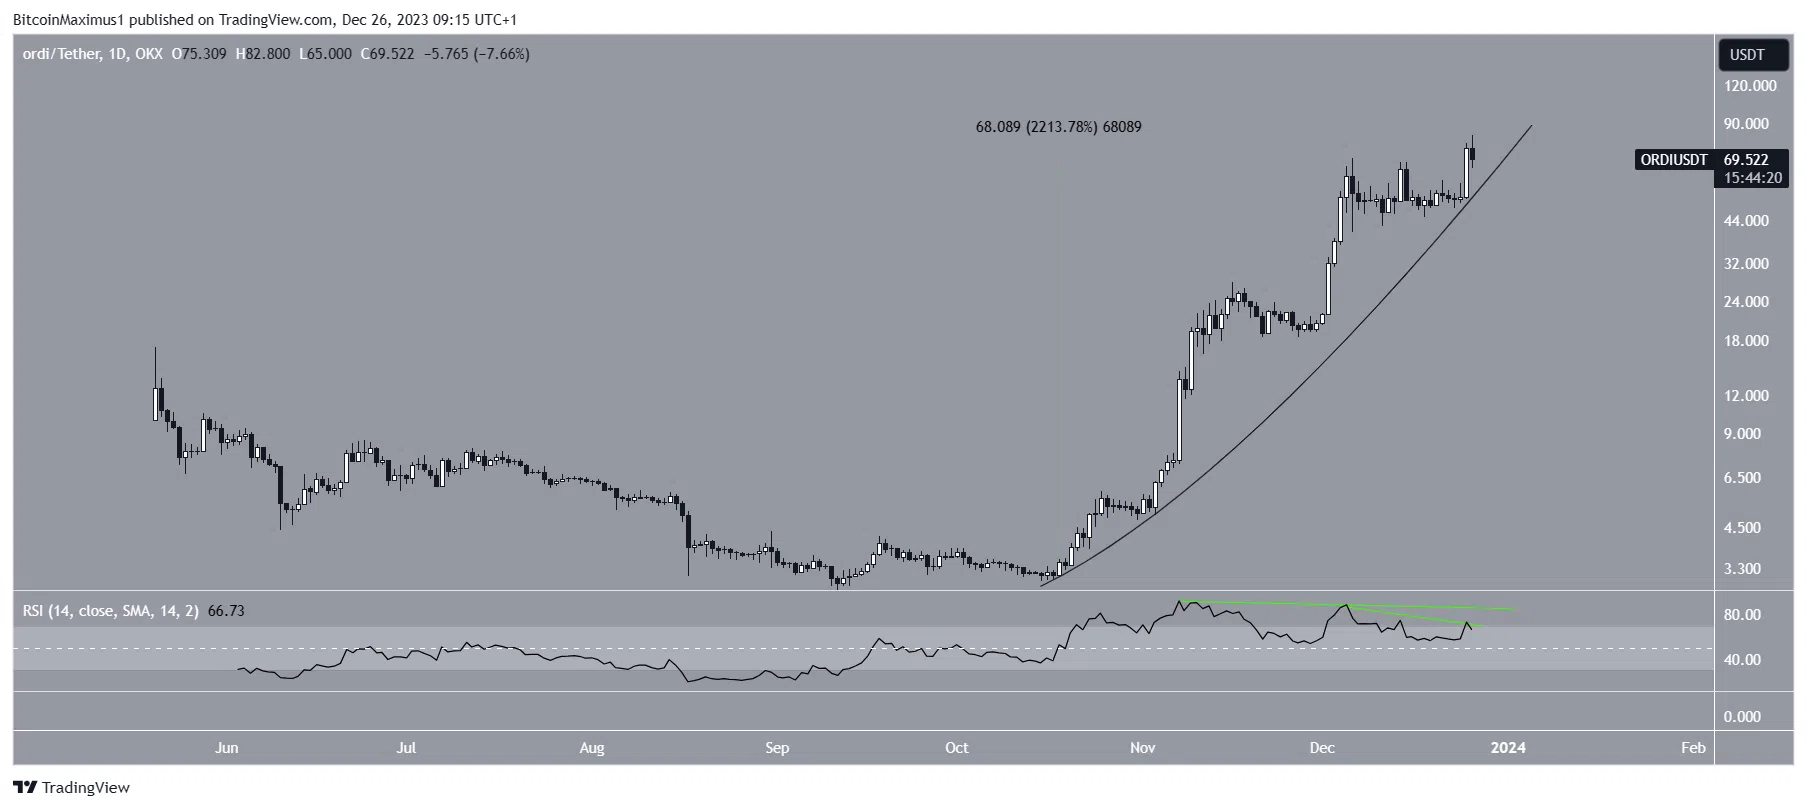
Market investors use the RSI level as a momentum indicator to determine overbought or oversold conditions and decide whether to accumulate or sell an asset. Levels above 50 and an upward trend suggest that the bulls are still at an advantage, while levels below 50 indicate the opposite.
Despite the rapid price increase, the ORDI front shows signs of weakness in the RSI. The indicator created a bearish divergence in December, where the price increase was accompanied by a decline in momentum.
ORDI Chart Analysis
Cryptocurrency analysts believe that the upward movement for ORDI is not over yet and expect the rise to continue. The famous analyst Tryrex explained that there was a breakout from a symmetrical triangle and suggested that the price has started another upward movement.
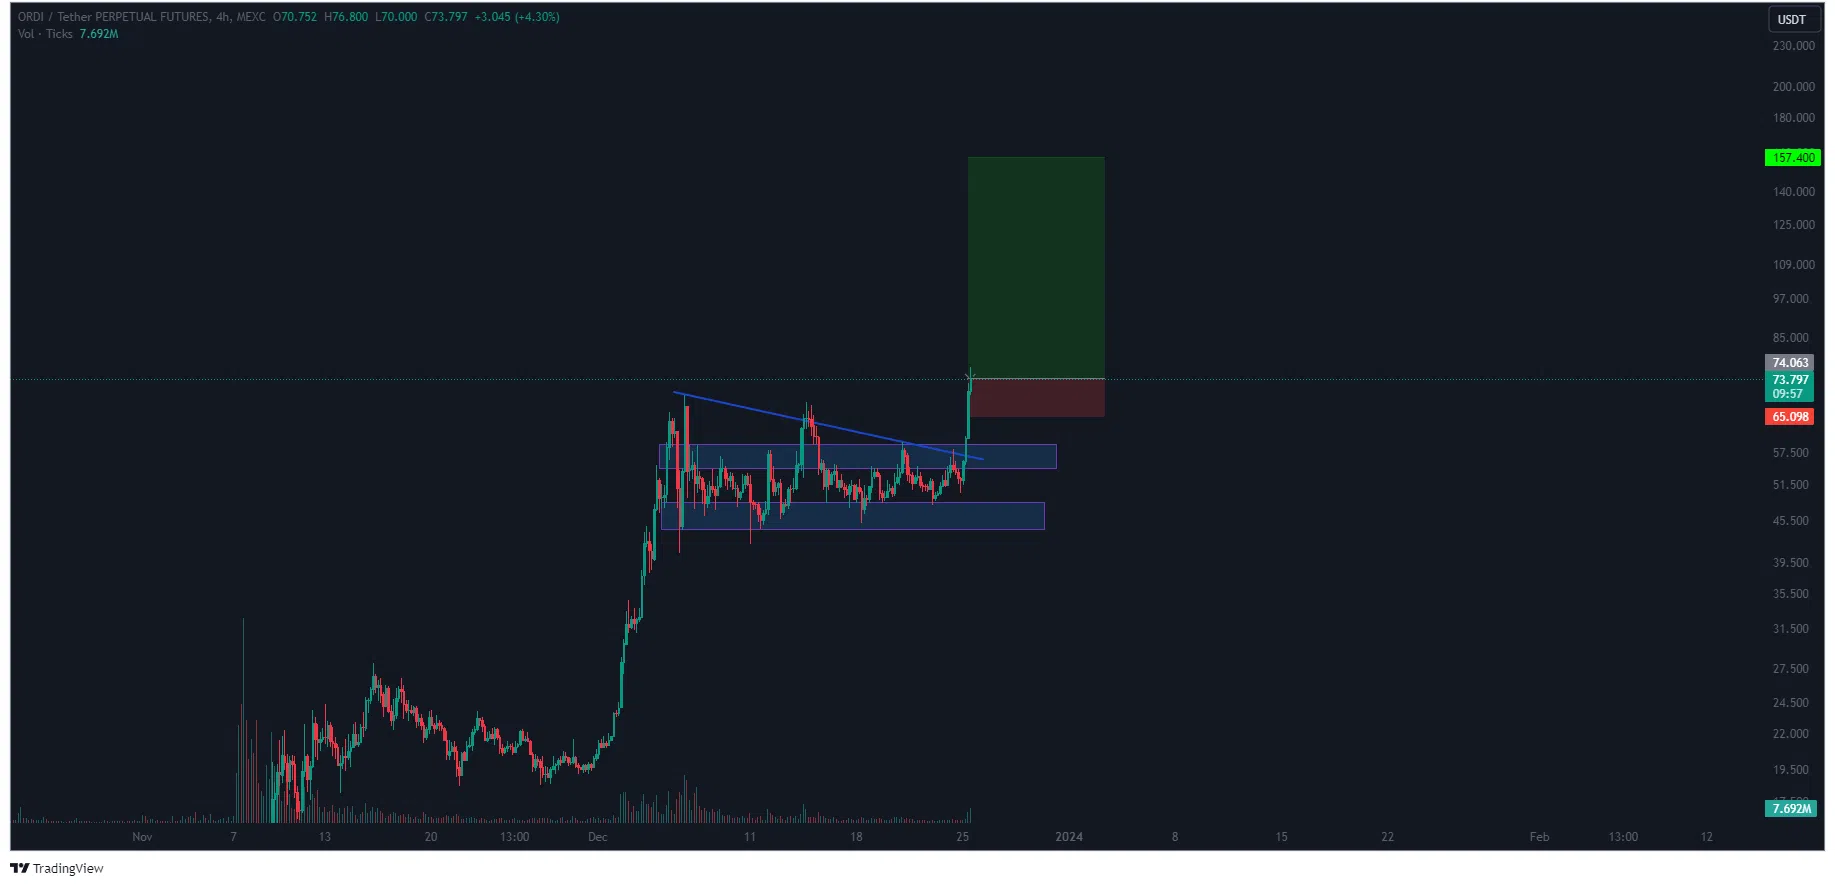
Another analyst, Teo, shares a similar view but uses horizontal ranges to reach a conclusion. Technical analysts use Elliott Wave theory to identify recurring long-term price patterns and investor psychology, which helps them determine the direction of a trend.
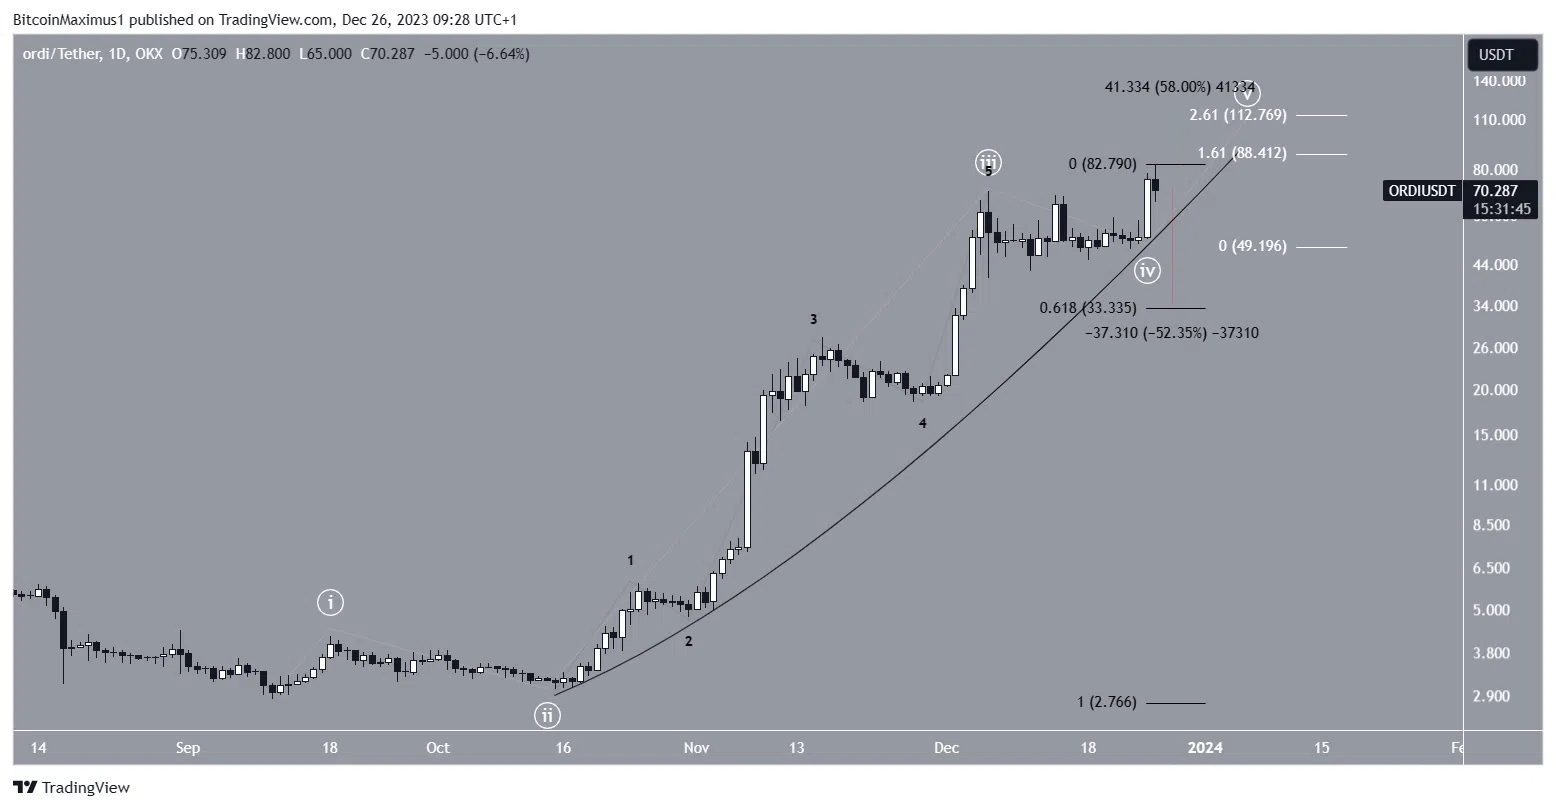
The most likely count shows that the ORDI price is in the fifth and final wave of an upward movement that began in October. Within it, the third wave has expanded significantly. The sub-wave count is in black. So far, the fifth wave was 1.61 times the length of the first wave. If ORDI surpasses this level, it could rise by 58% to the next resistance at $113.
As long as the ORDI price trades above the parabolic rising support trend line, the trend maintains its upward inclination. However, a break of the parabola could lead to a 50% drop to the 0.618 Fibonacci retracement support level of $33.
