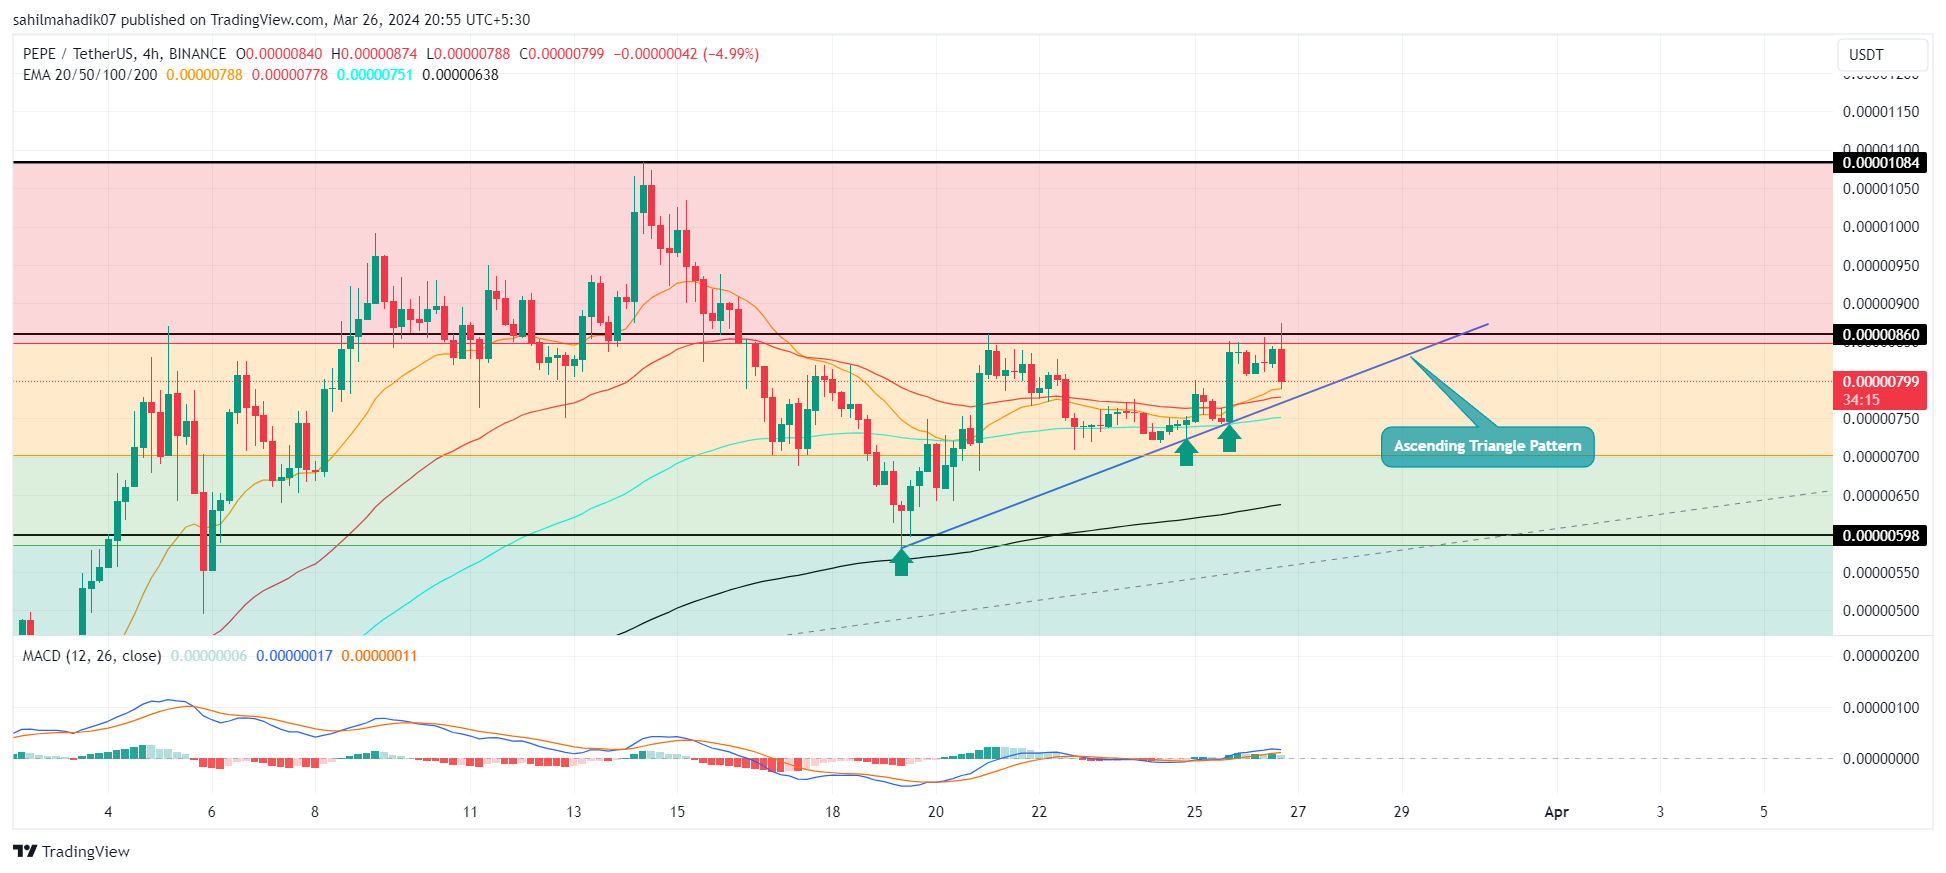
Crypto currency market witnessed Pepe price showing an uptrend from the psychological support of $0.000006. This positive turnaround has led to a 41% weekly increase, raising the price to $0.00000818. When examining the daily chart of the meme token, a price reversal is developing, indicating the token is ready for a higher recovery through a bullish pattern known as an ascending triangle.
Psychological Level in PEPE
The crypto market saw a significant correction in the third week of March, bringing the Pepe token price down to $0.000006. This psychological level, coinciding with the 50% retracement level, creates a high Area of Interest (AOI) for buyers to halt further price corrections. Theoretically, a drop to the 50% Fibonacci level is considered a healthy pullback for buyers to regain upward momentum.
With the help of an ascending trend line, this support was recently reversed, retesting the supply zone at the $0.00000857 level. Additionally, the indicated chart pattern resembles the formation of a bullish pattern known as an ascending triangle. The higher low formation could indicate that buyers are gradually strengthening their dominance over this token to lead a high-momentum rally.

Critical Formation in PEPE
Pepe token price is currently trading at $0.00000810 with a 0.37% intraday gain. With a market value of $3.4 billion, the meme token ranks among the top 50 cryptocurrencies according to CoinMarketCap. The impact of the triangle formation could lead to PEPE price breaking the $0.00000086 neckline, setting the stage for a higher recovery. A post-breakout rally could challenge the token’s value by 25%, reaching the peak level of $0.0000108. However, a break below the formation’s lower trend line could accelerate selling pressure towards a prolonged correction. In conclusion, the Pepe token in the crypto market has risen from the psychological support of $0.000006, achieving a 41% weekly increase to $0.00000818 and signaling a higher recovery with an ascending triangle formation. Yet, a break below the lower trend line of the formation could indicate a long-term correction.


