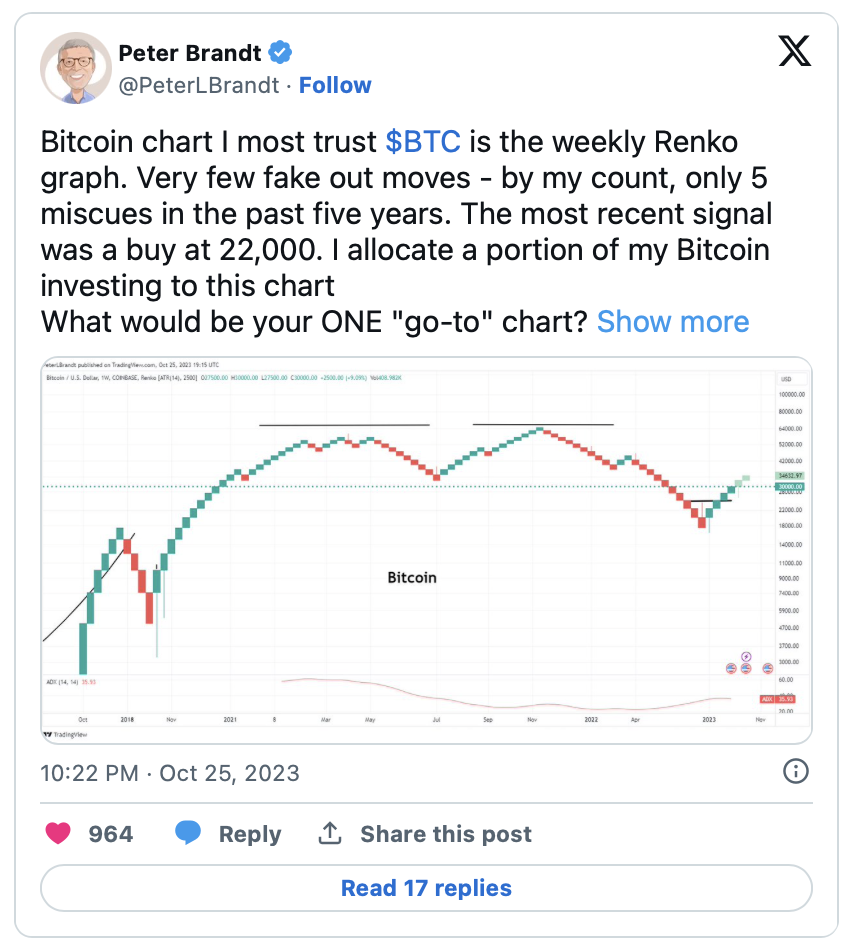
With over 40 years of market experience, Peter Brandt recently expressed his unwavering confidence in this unique technical analysis tool. The experienced trader and analyst shared the weekly Renko chart, which is the secret weapon in the highly volatile world of cryptocurrency trading, to put an end to Bitcoin‘s (BTC) journey.
Brandt’s Renko Chart
Unlike traditional charts, Brandt’s shared Renko chart consolidates small price movements into grouped blocks, providing a clear depiction of the dominant market trend. Brandt’s confidence in the Renko chart stems from its remarkably high accuracy. In the past five years, only five of the signals provided by the chart did not materialize, making it an extremely reliable technical analysis tool, according to the analyst.

One of the recent signals on the Renko chart was a buy signal that came when Bitcoin’s price dropped to $22,000. Considering that the price of the largest cryptocurrency is currently trading around $34,000, it appears that this last signal provided significant gains.
The methodology behind the Renko chart is simple yet powerful. Investors and traders can distinguish continuous upward or downward trends based on predefined blocks or bricks that consolidate price movements.
Bitcoin Hits Bottom, According to Brandt
Despite his confidence in the Renko chart, Brandt emphasized the unpredictable nature of financial markets, especially the cryptocurrency market, and highlighted that technical analysis continues to be subject to reality. The experienced analyst warned against those who claim to predict the future path of any market, stating that even the most experienced experts can be surprised by the markets.
However, Brandt recently provided clarity on a few important points based on the technical analysis tool. The analyst stated that BTC has hit bottom and will not reach new highs until the third quarter of 2024, and volatile market conditions will continue until then.
As all participants in the cryptocurrency market closely monitor Bitcoin’s price movements, it will be interesting to see if Brandt’s expectations are met and if the Renko chart continues to provide reliable signals.


