Following the accelerated process regarding Binance exchange, the expected crypto crash did not occur. This was also the aim of the US. Now, a new phase has begun in the crypto market, but the markets have not yet fully recovered from the recent shock. So, what is the current situation of Polkadot (DOT) in a possible rally scenario? What are investors expecting?
Polkadot (DOT) Reviews
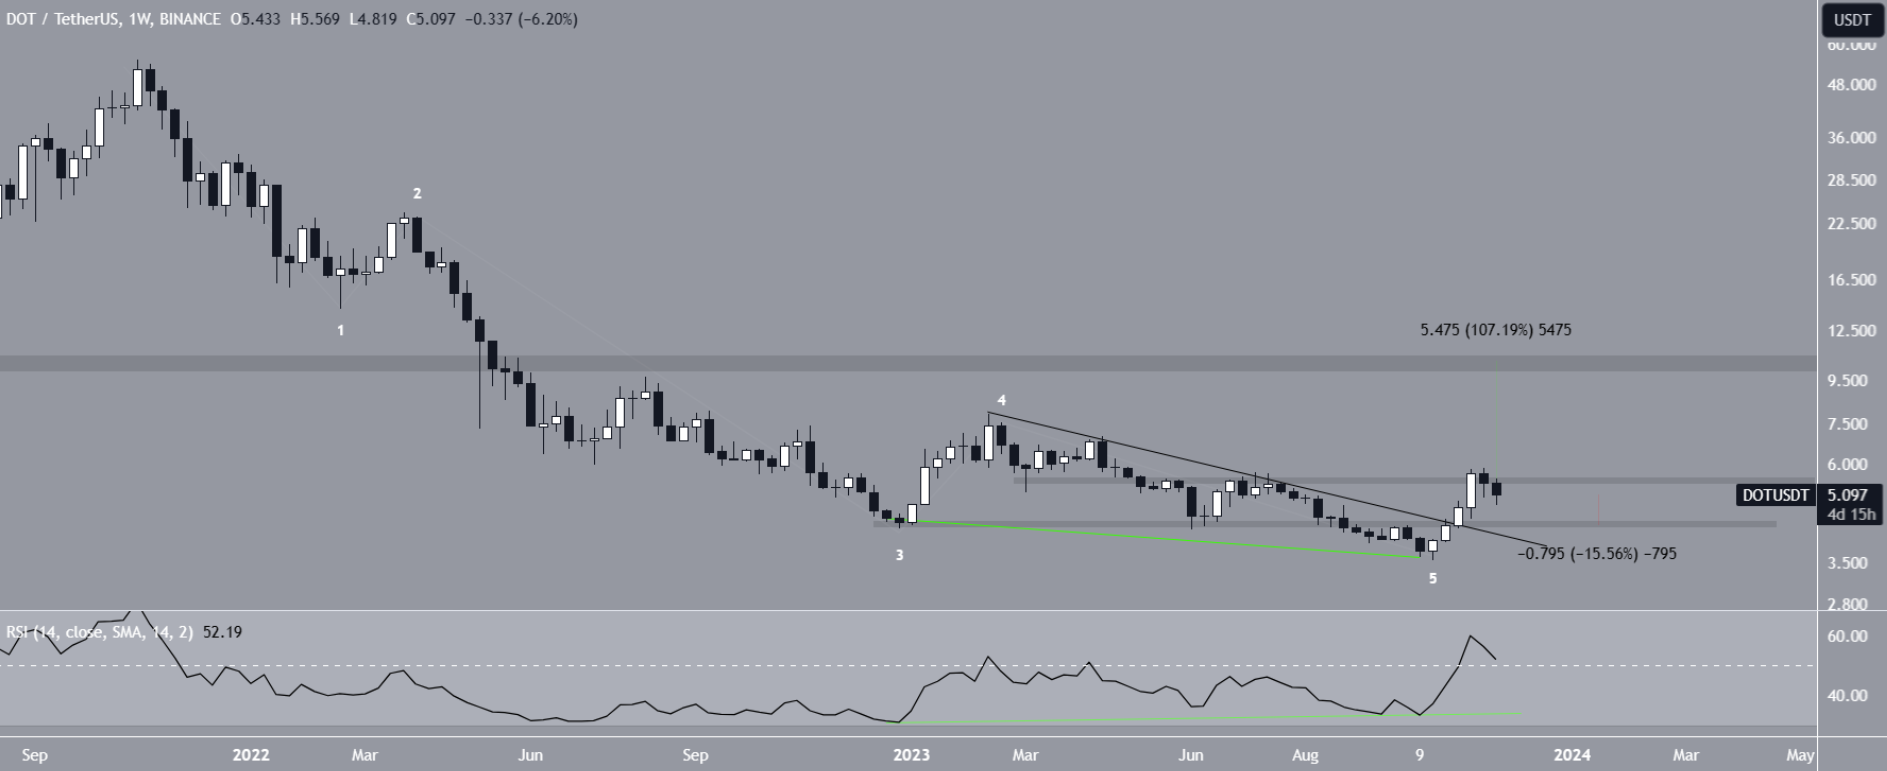
On the weekly chart, the price of DOT coin has been lingering below the declining resistance line since February. This negative trend triggered a drop to $3.56 in October. We saw that an important support level was lost for DOT coin, which had remained in place throughout the year.
However, after the bottom area, the price of DOT coin started to rise for four weeks. The popular altcoin, which escaped from the declining resistance line, reached its peak of $5.90 last week and saw the best price in 200 days. It becomes much harder to hold such gains during periods of high volatility. Altcoins like DOT coin, which has been lingering at lows for a long time and recovering, are much more fragile and have investors with weakened risk appetite. The bearish candle was also a result of this. Crypto Traders Are Rushing to This App – Here’s Why You Should Too
Nevertheless, the fact that the RSI is above the neutral zone and the price is sending recovery signals is a reason not to give up optimism.
DOT Coin Analyst Reviews
Crypto analysts are often wrong, and the only thing investors need from them is the need to “observe the market from different perspectives.” Analysts do not give you information about the future, but they offer you different interpretations of the market outlook, providing you with a richer perspective. For example, Rekt Capital points out the breaking of the same declining resistance trend line and says the following:
“The retest seems to have been successful. Any move towards the top of the formation, even in December, will be a signal of macro uptrend.”

Crypto Tony, on the other hand, has a short-term bullish view on DOT coin as long as the price is held above the $5.50 horizontal area. So, what does technical analysis say? According to the Elliott wave count, the price has completed its five-wave downward movement. If this analysis is correct, it indicates the start of a new movement in the opposite direction.

The weekly RSI confirms the uptrend. If the expected movement has started, it is likely that we will see a new high at $10. However, failure to reclaim the $5.50 region could trigger a drop to $4.40.


 Türkçe
 Español


