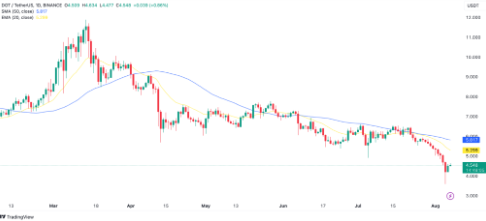
Polkadot’s (DOT) price saw an 18% drop last week. The global economic collapse on Monday caused DOT to fall below the $5 price level for the first time since November 2023. On the same day, DOT dropped to $3.75 before recovering. Currently trading at $4.48, DOT seems poised to make a move towards the $5 level.
Polkadot Analysis
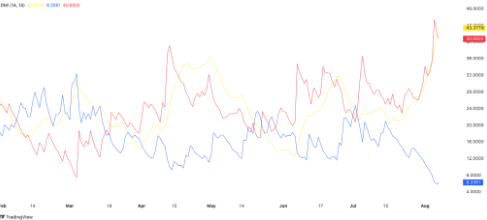
An analysis of DOT’s daily chart shows that existing technical indicators suggest increased selling pressure could hinder the price from rising to $5. As of the time of writing, DOT’s Directional Movement Index (DMI) indicators show the negative directional indicator (-DI) (red) is above the positive directional indicator (+DI) (blue).

The DMI value of the analyzed asset reveals the strength and direction of the market trend. A downtrend gains strength when the +DI line is below the -DI line. This indicates that sellers are stronger than buyers in the market. The widening distance between the DI and +DI adds strength to the downward momentum. For DOT, the -DI line is at 40.69 while the +DI line is at 6.20, which is significant.
Additionally, DOT’s 20-day exponential moving average (EMA) (yellow) and 50-day simple moving average (SMA) (blue) are noted to be below.
A 20-day EMA is a short-term moving average that quickly reflects price changes. It shows the average closing prices over the last 20 days. On the other hand, the 50-day SMA is a longer-term indicator showing the average closing prices over the last 50 days.

DOT Price Predictions
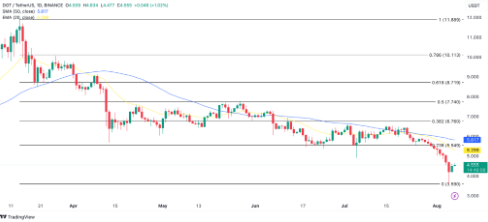
DOT’s 20-day EMA and 50-day SMA could act as resistance levels. Attempts by bulls to move above these levels could trigger selling pressure and continue the downtrend. In such a scenario, DOT’s price could drop to $3.59, the lowest level in nine months, seen on Monday.

However, a possible trend reversal and market recovery could positively impact DOT. If DOT moves above the moving averages, the price target could be $6.76.


