Once the star of the last bull season, this altcoin, traded on numerous popular exchanges including Binance, could not perform as promised, and interest is fading. Even though it has seen a significant recovery recently, sustainability of this trend seems unlikely. So, what do the current technical readings say about the critical levels?
Polkadot (DOT) Faces Potential Decline
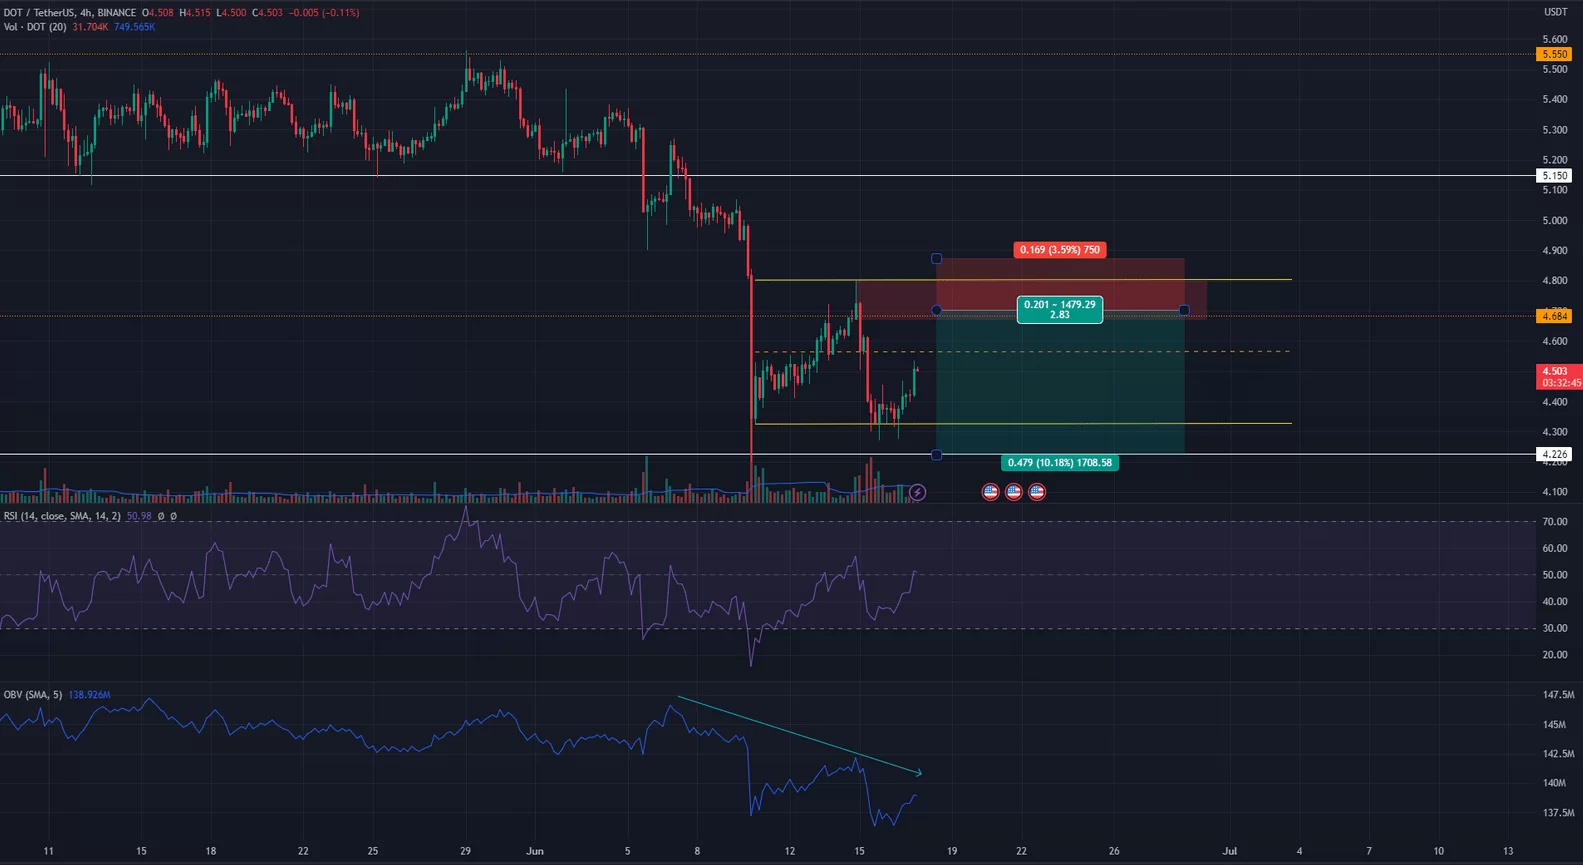
Polkadot’s failure to defend the $5.2 region against bears on June 5 was a clear sign of a strong bearish trend in the market. DOT plunged to a low of $4.2 before surging past the $4.68 support on June 10. As of writing, the trend was still in favor of sellers despite the bounce from the bottom.
The bounce to $4.8 four days ago was followed by a sharp drop to the $4.32 support. Over the past week, DOT swung between $4.32 and $4.8 support and resistance levels. The $4.68 region has been a critical area for DOT in the past. Moreover, a sell order block, highlighted with a red box on the 4-hour chart, can be observed in the $4.67-$4.8 range.
After the retest of the sell order block, a rejection of Polkadot prices is likely. This is due to the OBV being in a downtrend reflecting intense selling pressure throughout the past week.
DOT Coin Commentary
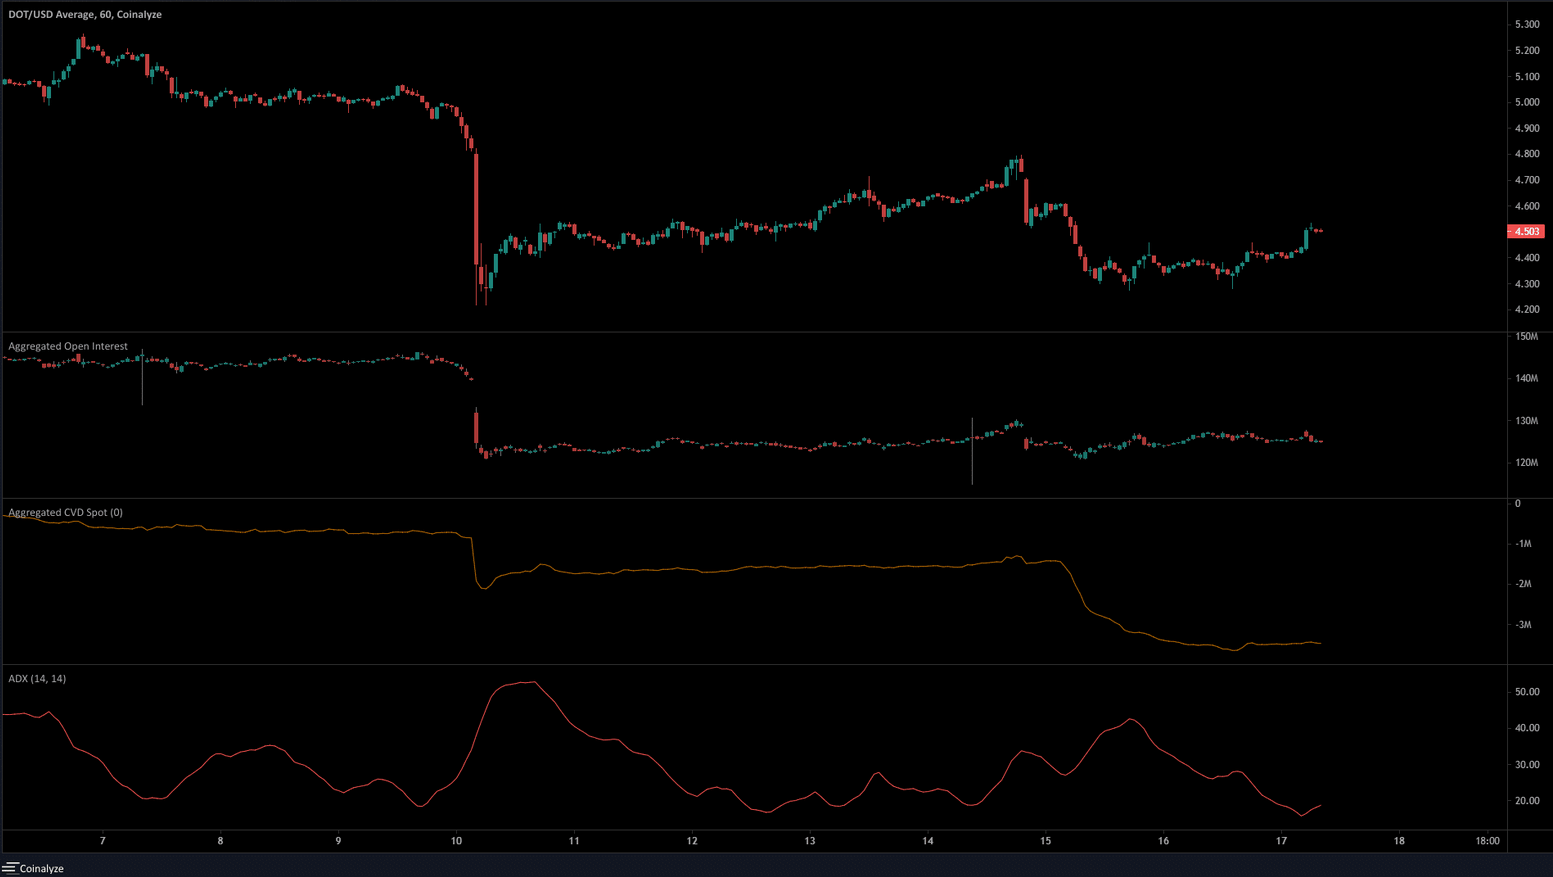
The RSI is at the edge of the neutral zone, and what bulls need is for the king cryptocurrency to close above $27,200. The Open Interest graph on Coinalyze’s 1-hour chart reveals a near $6 million increase in OI over the past two days. Sentiment currently supports sellers, and a recovery in DOT prices doesn’t seem likely until Spot CVD rises.
In the medium to long term, if sales continue, we might see a price drop to the low of August 2020. In this scenario, DOT Coin will seek new support between $2.5 and $3.8. After soaring to an ATH price above $55, the popular altcoin’s steady approach to its 3-year low level shows us the cruelty of bear markets. Even during the FTX crash last year, the price didn’t drop below $4.22. The strongest support areas for now are here and at the $3.71 level.


