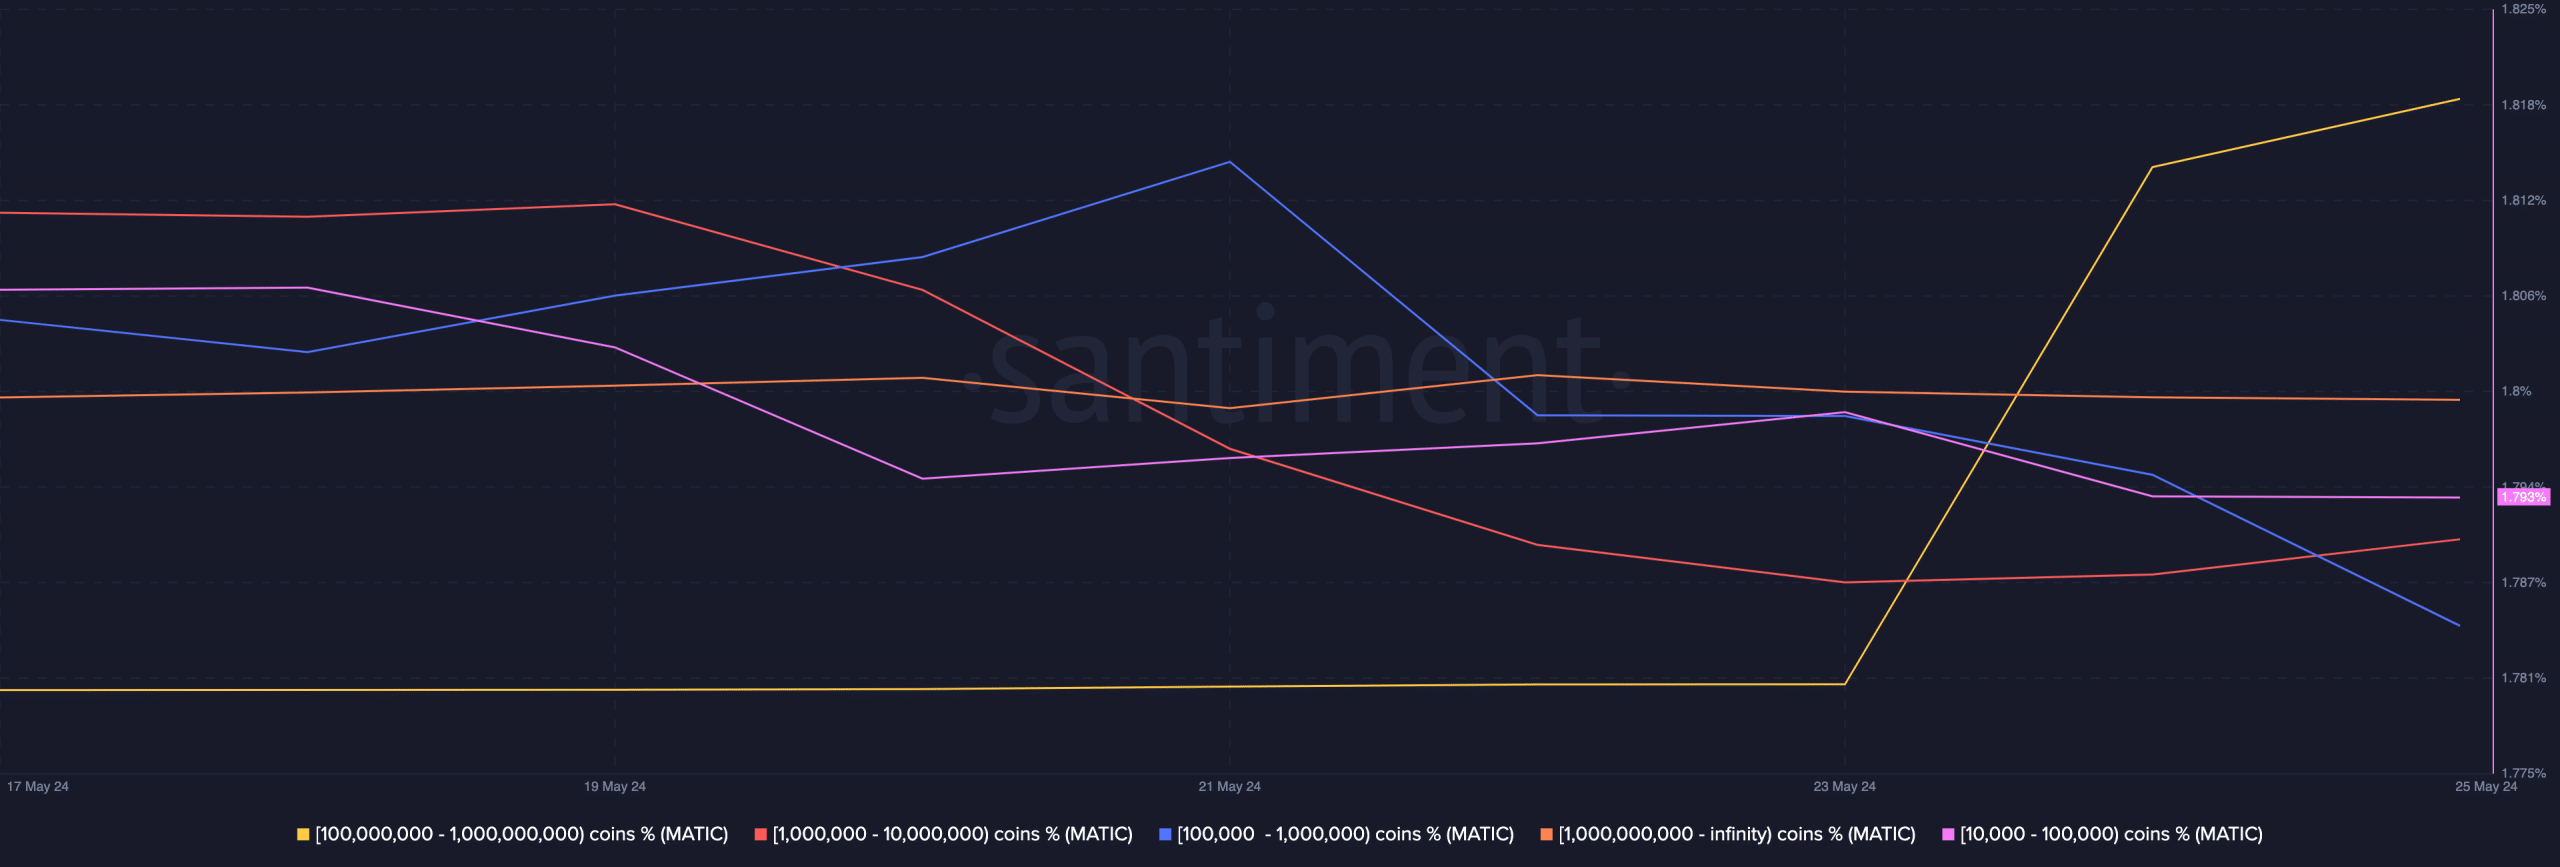
Unlike many other altcoin projects, Polygon addresses holding 100 million to 1 billion tokens continue to increase. This reflects a notable trend according to data provided by Santiment. According to the blockchain data analysis platform, this group’s holdings constituted 16.17% of the total supply as of May 23.
What Is Happening with MATIC?
This increase indicates growing confidence in the token’s long-term potential but may affect MATIC’s short-term price movement. For instance, if whales decide to distribute a large portion of their holdings, the token price could drop. Therefore, the increase in balance has the potential to push Polygon’s price higher. At the time of writing, the token’s price was $0.72, marking a 25.48% decline over the last 90 days.

However, MATIC has been trying to trade higher over the past month. Yet, every attempt to reach and surpass the $0.80 resistance has been rejected. Recent accumulation could potentially lead to a rise in Polygon’s price.
Another notable data point is the liquidation levels. This data highlights high liquidity areas, indicating the price levels a cryptocurrency could reach. As of the time of writing, high liquidity in the MATIC chart exists between $0.75 and $0.78. This magnetic region suggests that the token may soon move in this direction.
Notable Data Points
The same chart shows that the Cumulative Liquidation Levels Delta (CLLD) confirms the prediction. In context, CLLD shows the difference between long and short liquidations. Positive readings of the indicator indicate more long liquidations than short positions. Conversely, negative readings of CLLD mean more short liquidations than long positions.

Additionally, the indicator affects price movement. For Polygon’s price, this process could indicate an imminent sharp recovery, punishing late positions trying to catch the dip. Furthermore, the Mean Dollar Invested Age (MDIA) shows that most participants are turning to MATIC. The data indicates the average duration that all existing Polygon addresses have held their tokens. A decrease in MDIA readings indicates increased transaction activity. Sometimes, this can increase selling pressure, and as of the time of writing, the 90-day MDIA has started to rise.

The last time this data showed such a consistent move, MATIC rose from $0.71 to $1.27. Although the situation may not be the same this time, the token’s price could approach or exceed $1 in the medium term.

 Türkçe
 Español


