Türkçe
 Español


The cryptocurrency market has seen a rise similar to the one in 2021, with blockchain projects coming to the forefront. In particular, the momentum in the prices of Solana and Avax has been notable as users prefer these ecosystems. However, during this period, Polygon continues to maintain its silence, which is leading to selling pressure. So, what is happening on the MATIC front in the coming period? Let’s examine together.
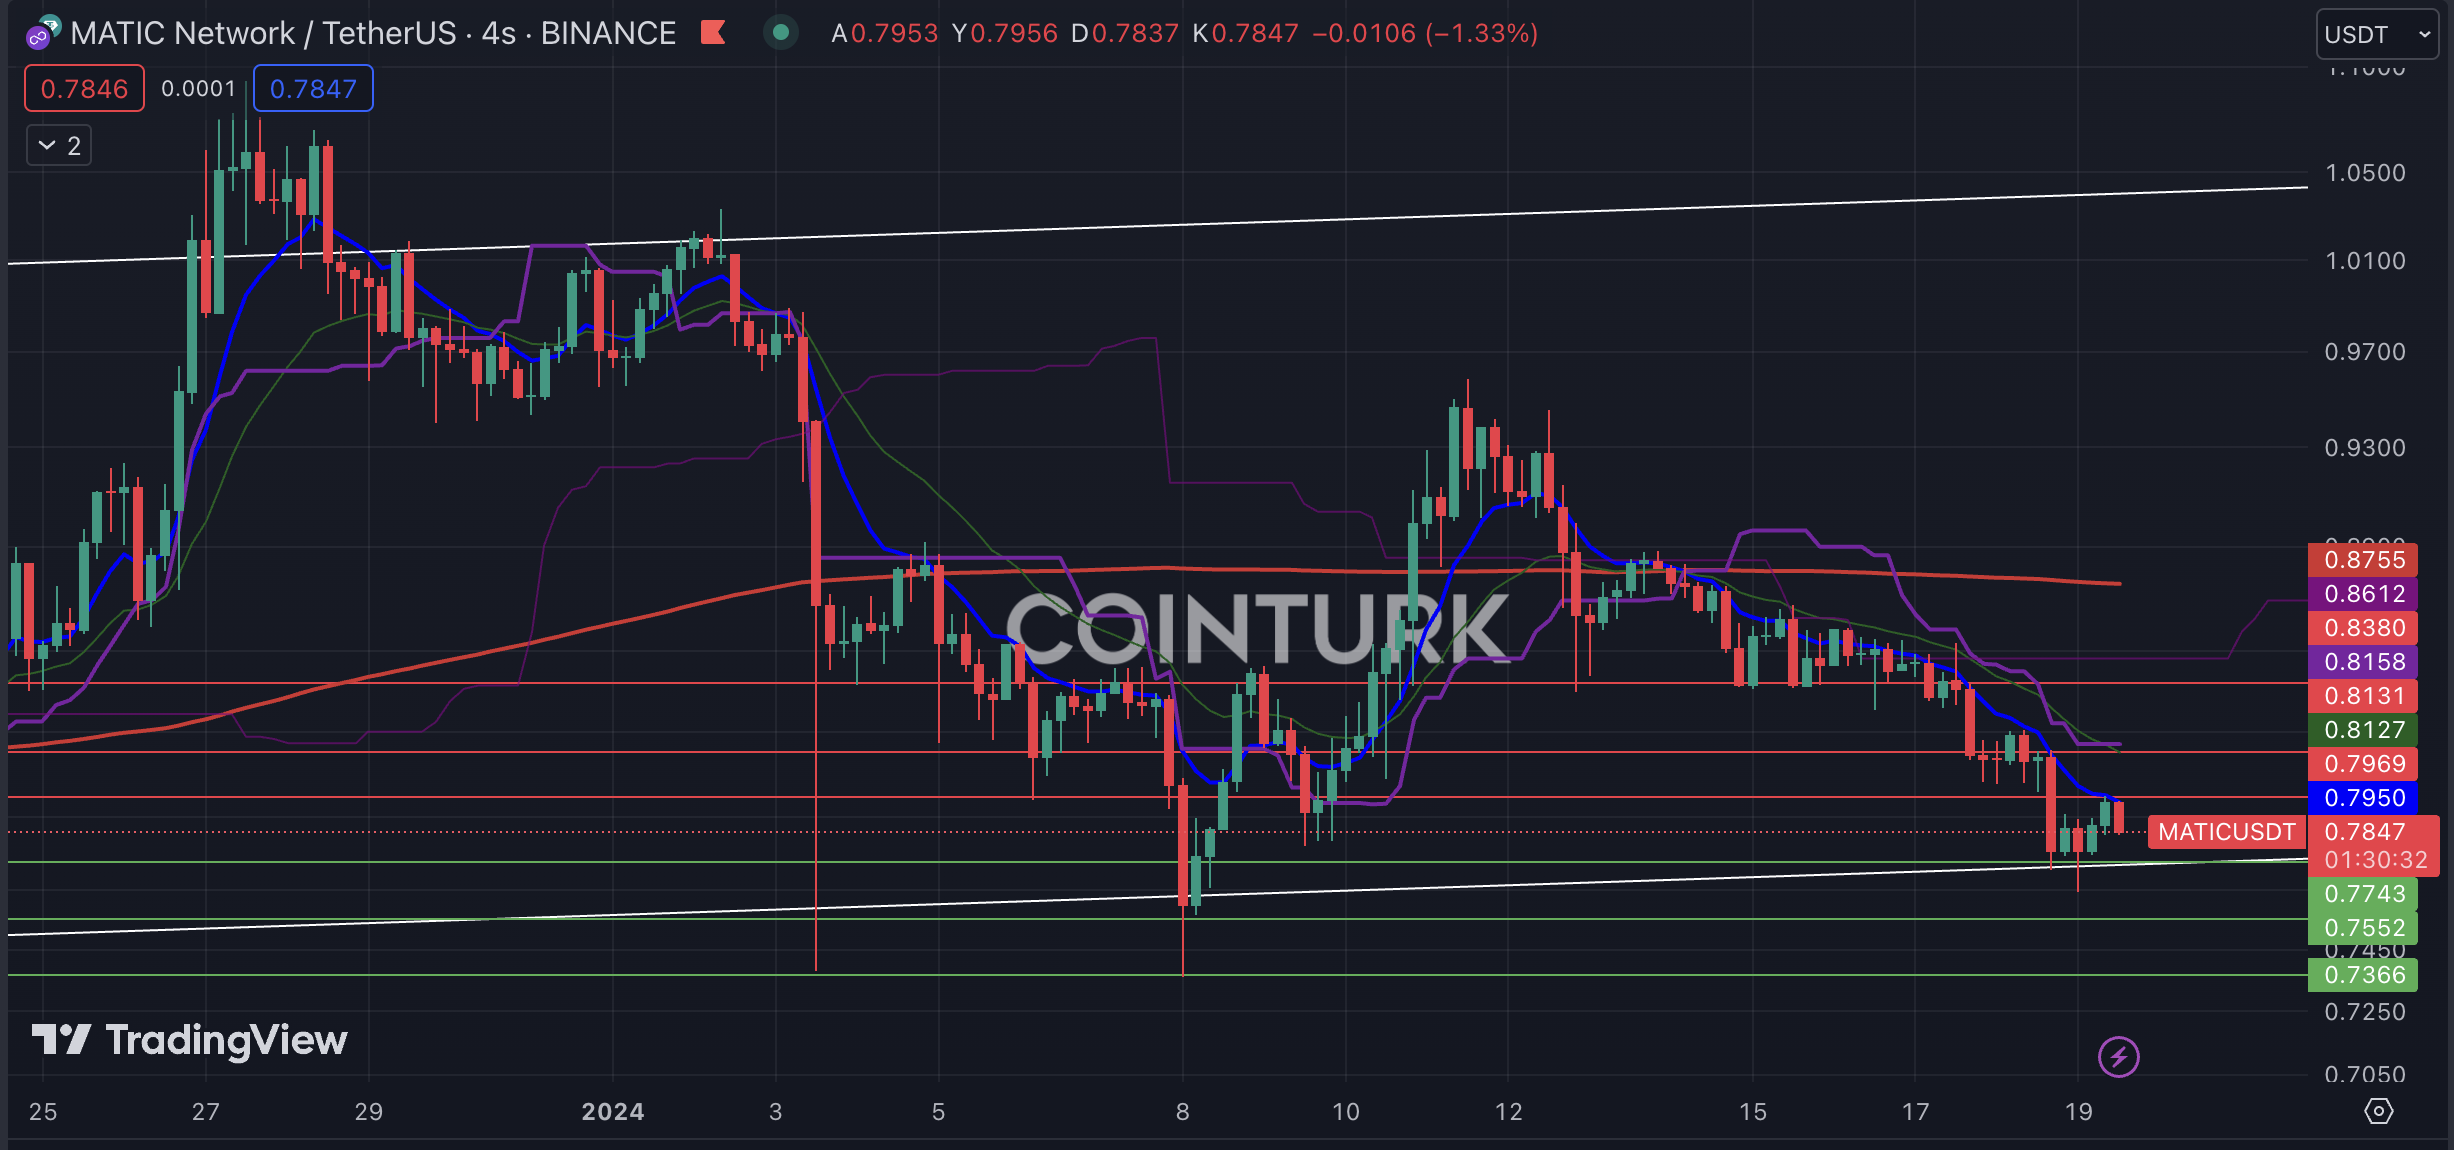
Polygon Four-Hour Chart Analysis
The four-hour MATIC chart highlights a rectangle formation. This chart structure indicates that the crypto asset has been trading in the same area for a long period. MATIC has broken the support line three times in 2024, and these price movements have acted as a bear trap. However, MATIC faced significant selling pressure below the EMA 200 level (red line).
The most important support levels to watch on the four-hour MATIC chart are; 0.7743 / 0.7552 and 0.7366 dollars, respectively. Particularly, a four-hour bar closing below the 0.7743 dollar level, which intersects with the formation support line, will cause MATIC price to encounter selling pressure.
The most important resistance levels to follow on the four-hour MATIC chart are; 0.7969 / 0.8131 and 0.8380 dollars, respectively. Especially, a four-hour bar closing above the 0.7969 dollar level, which intersects with the EMA 21 level (blue line), will help MATIC price gain momentum.

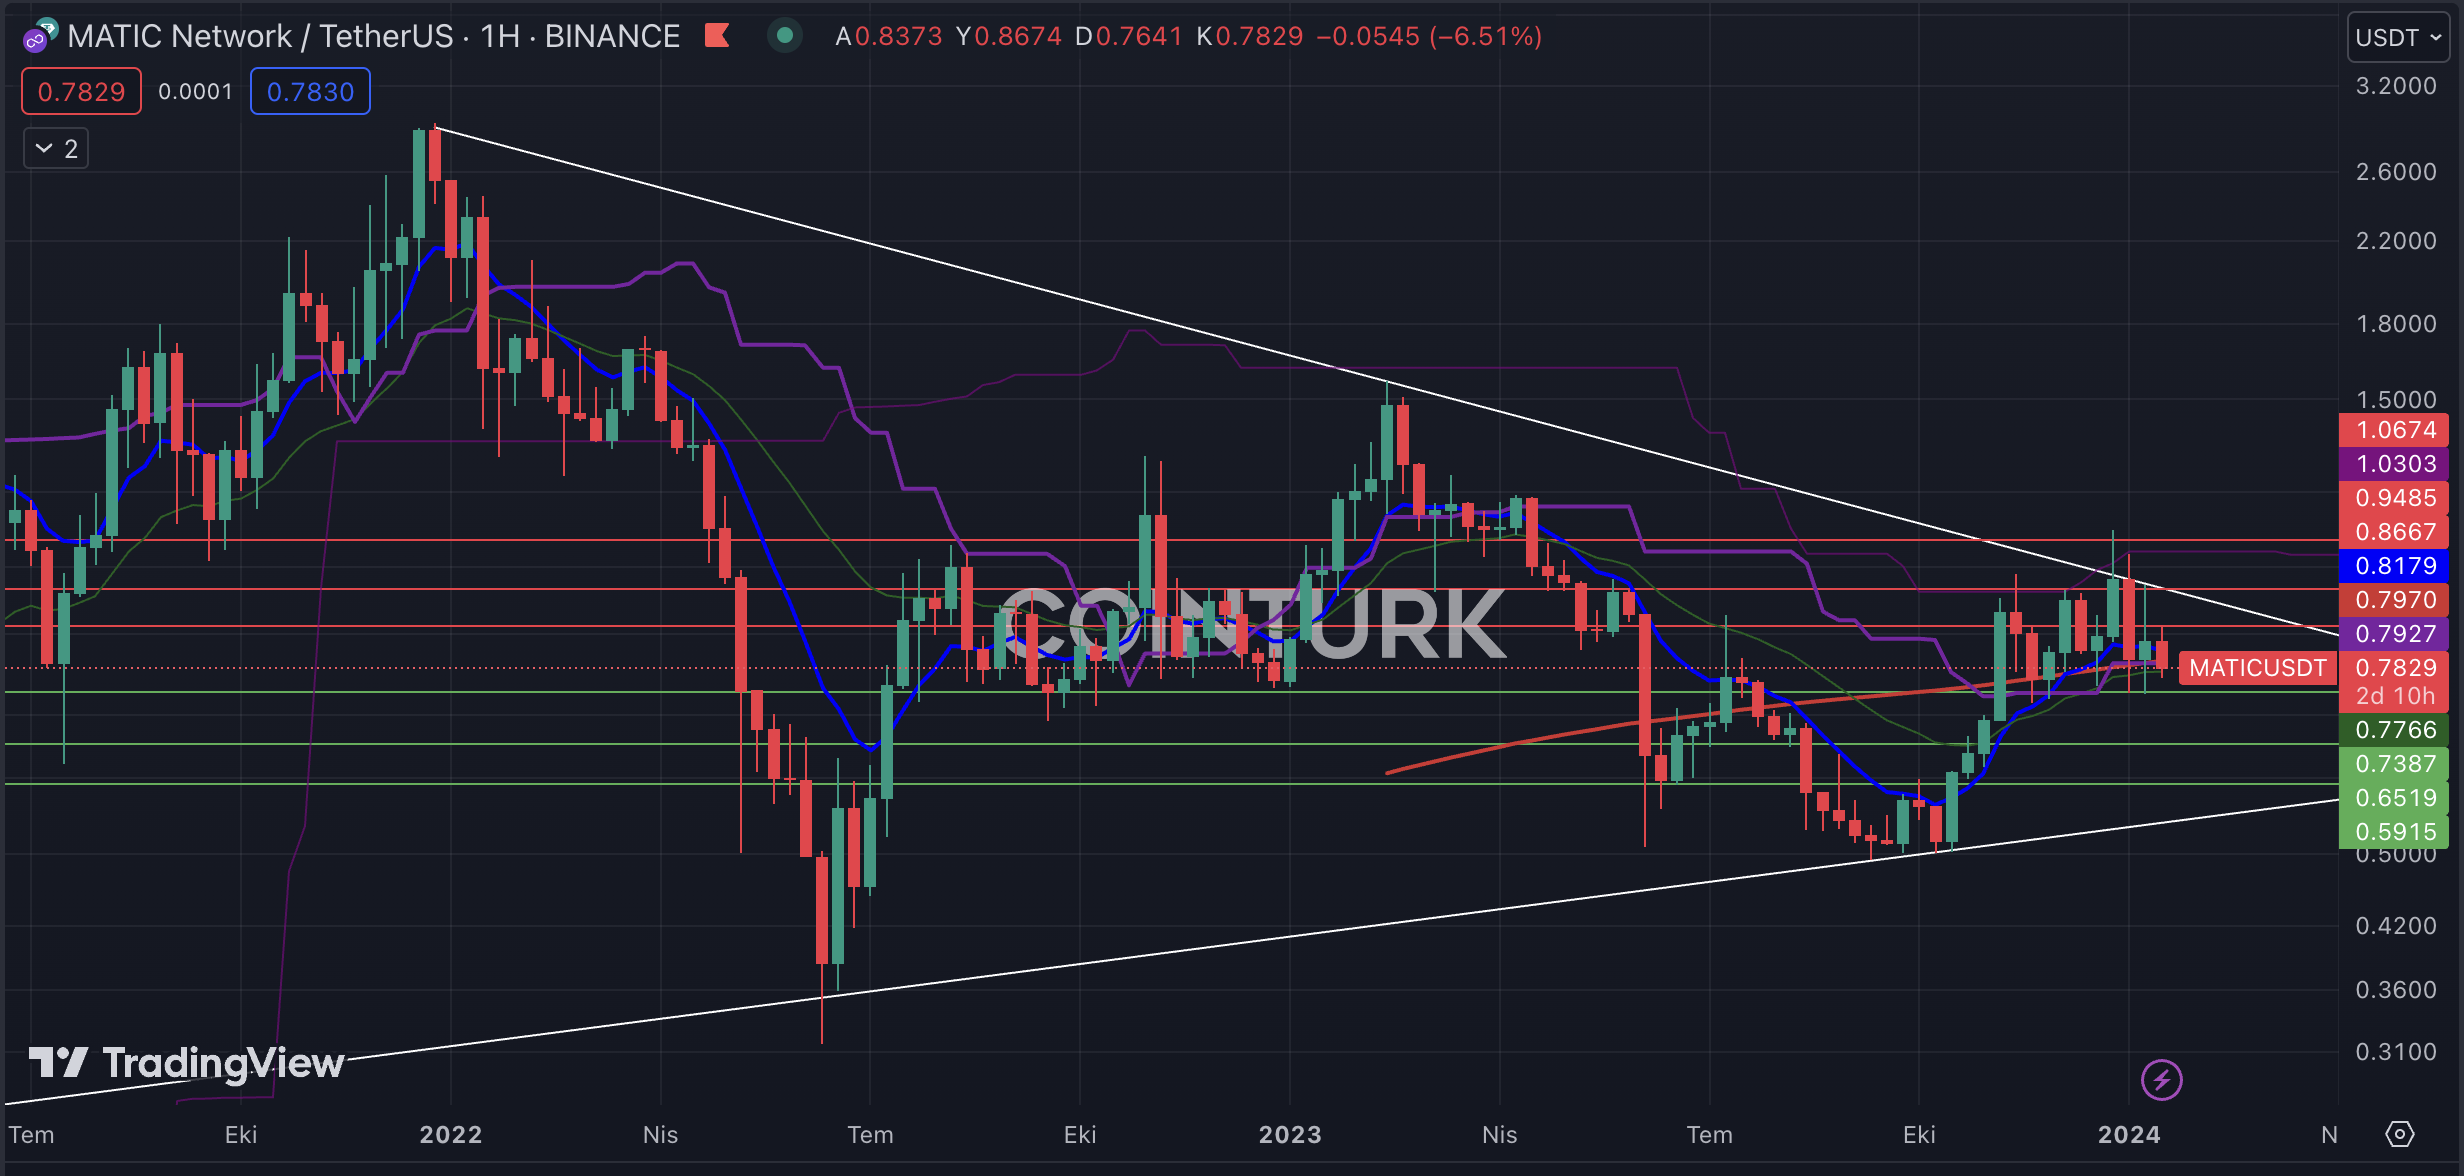
Polygon Weekly Chart Analysis
The weekly MATIC chart shows a triangle pattern formation. In this formation, a break of support or resistance will determine the direction. The fact that the last bar formation closed below the EMA 200 level on the weekly chart could create selling pressure for MATIC.
The most important support levels to monitor on the weekly MATIC chart are; 0.7387 / 0.6519 and 0.5915 dollars, respectively. Particularly, a weekly bar closing below the 0.7387 dollar level, which plays a significant role in the last bar formations, will lead to selling pressure on the MATIC price.
The most important resistance levels to consider on the MATIC chart are; 0.8667 / 0.9485 and 1.0674 dollars, respectively. Especially, a weekly bar closing above the 0.9485 dollar level, which intersects with the formation resistance line, will help MATIC price gain momentum.