Polygon (MATIC) price is rapidly approaching the lowest levels of the year, emerging from a critical horizontal support area. Although the price movement is still bearish, wave counts and RSI readings indicate that the price may soon reach a bottom level.
MATIC Coin Review
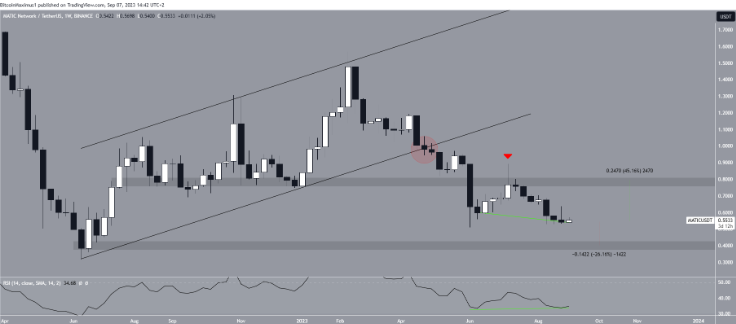
The weekly timeframe for MATIC presents a downward outlook. This could be due to two main reasons, both related to price movement. First, the MATIC price dropped from a rising parallel channel’s support line in April. Since the channel had been in place since June 2022, this was a significant bearish development. Therefore, the channel’s break could indicate that the trend is now bearish.
This was confirmed when the price fell below the $0.80 horizontal area and was validated as resistance in July (red icon). The subsequent rejection created a very long upper wick, which is considered a sign of selling pressure.
Since the breakdown, the MATIC price has declined and is currently trading at $0.55. If the downward movement continues, the next nearest support could be $0.40, which represents a 26% drop from the current price.

The weekly Relative Strength Index (RSI) shows mixed signals. Investors can use RSI as a momentum indicator to determine whether a market is overbought or oversold and decide whether to accumulate or sell an asset.
If the RSI value is above 50 and the trend is upward, bulls may have an advantage, but if the value is below 50, the opposite is true. On one hand, the indicator is below 50, indicating a bearish trend. On the other hand, it has created a bullish divergence, which is often a precursor to a reversal of an uptrend. Therefore, the weekly RSI provides uncertain readings for the future trend.
However, there is some positive news regarding Polygon (MATIC) price. LimeWire is building a new platform on Polygon that uses artificial intelligence to produce NFTs and pays original content creators in return. Additionally, Wirex and Veloce are being deployed on Polygon.
MATIC Price Prediction
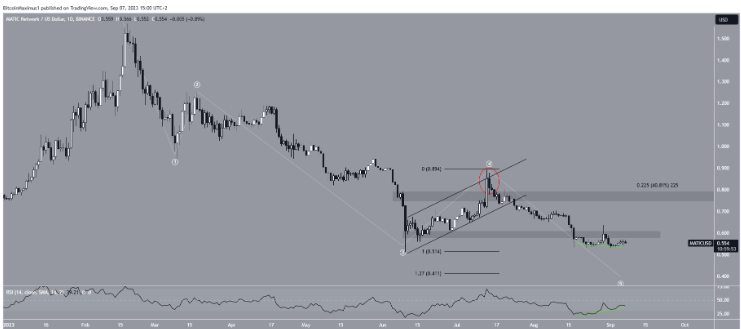
The daily timeframe presents a bearish outlook for MATIC, but it also indicates that a bottom may be reached soon. This is due to wave counting, and the RSI also shows that the price is approaching a bottom. Technical analysts use Elliott Wave theory to determine the direction of a trend by studying recurring long-term price patterns and investor psychology.
The most likely count indicates that MATIC is in its fifth and final wave of the downtrend that began in February. The shape of the fourth wave is making progress in supporting this correct count.
The fourth wave was contained within a rising parallel channel, which is common in such corrective movements. Additionally, the peak of the fourth wave caused a deviation above the $0.80 horizontal area, which later turned into resistance.

If the downtrend continues, the MATIC price will complete its fifth and final wave at $0.41, which is the 1.27 external Fib retracement of the fourth wave. This target aligns with the long-term horizontal support area at $0.40. Furthermore, the daily RSI has started to create a bullish divergence, which is a sign associated with bottoms.
Therefore, the most likely MATIC price prediction is a drop to $0.40 followed by a significant bounce. However, reclaiming the $0.60 area could mean that the bottom is in and the price could rise by 40% to the next resistance at $0.80.

 Türkçe
 Español


