The cryptocurrency market has seen increased volatility recently, particularly affecting major assets like Bitcoin due to resurfacing geopolitical issues. This has reintroduced selling pressure in the markets. What can be expected for Bitcoin and Ethereum? We explore this with detailed chart analyses.
Bitcoin Chart Analysis
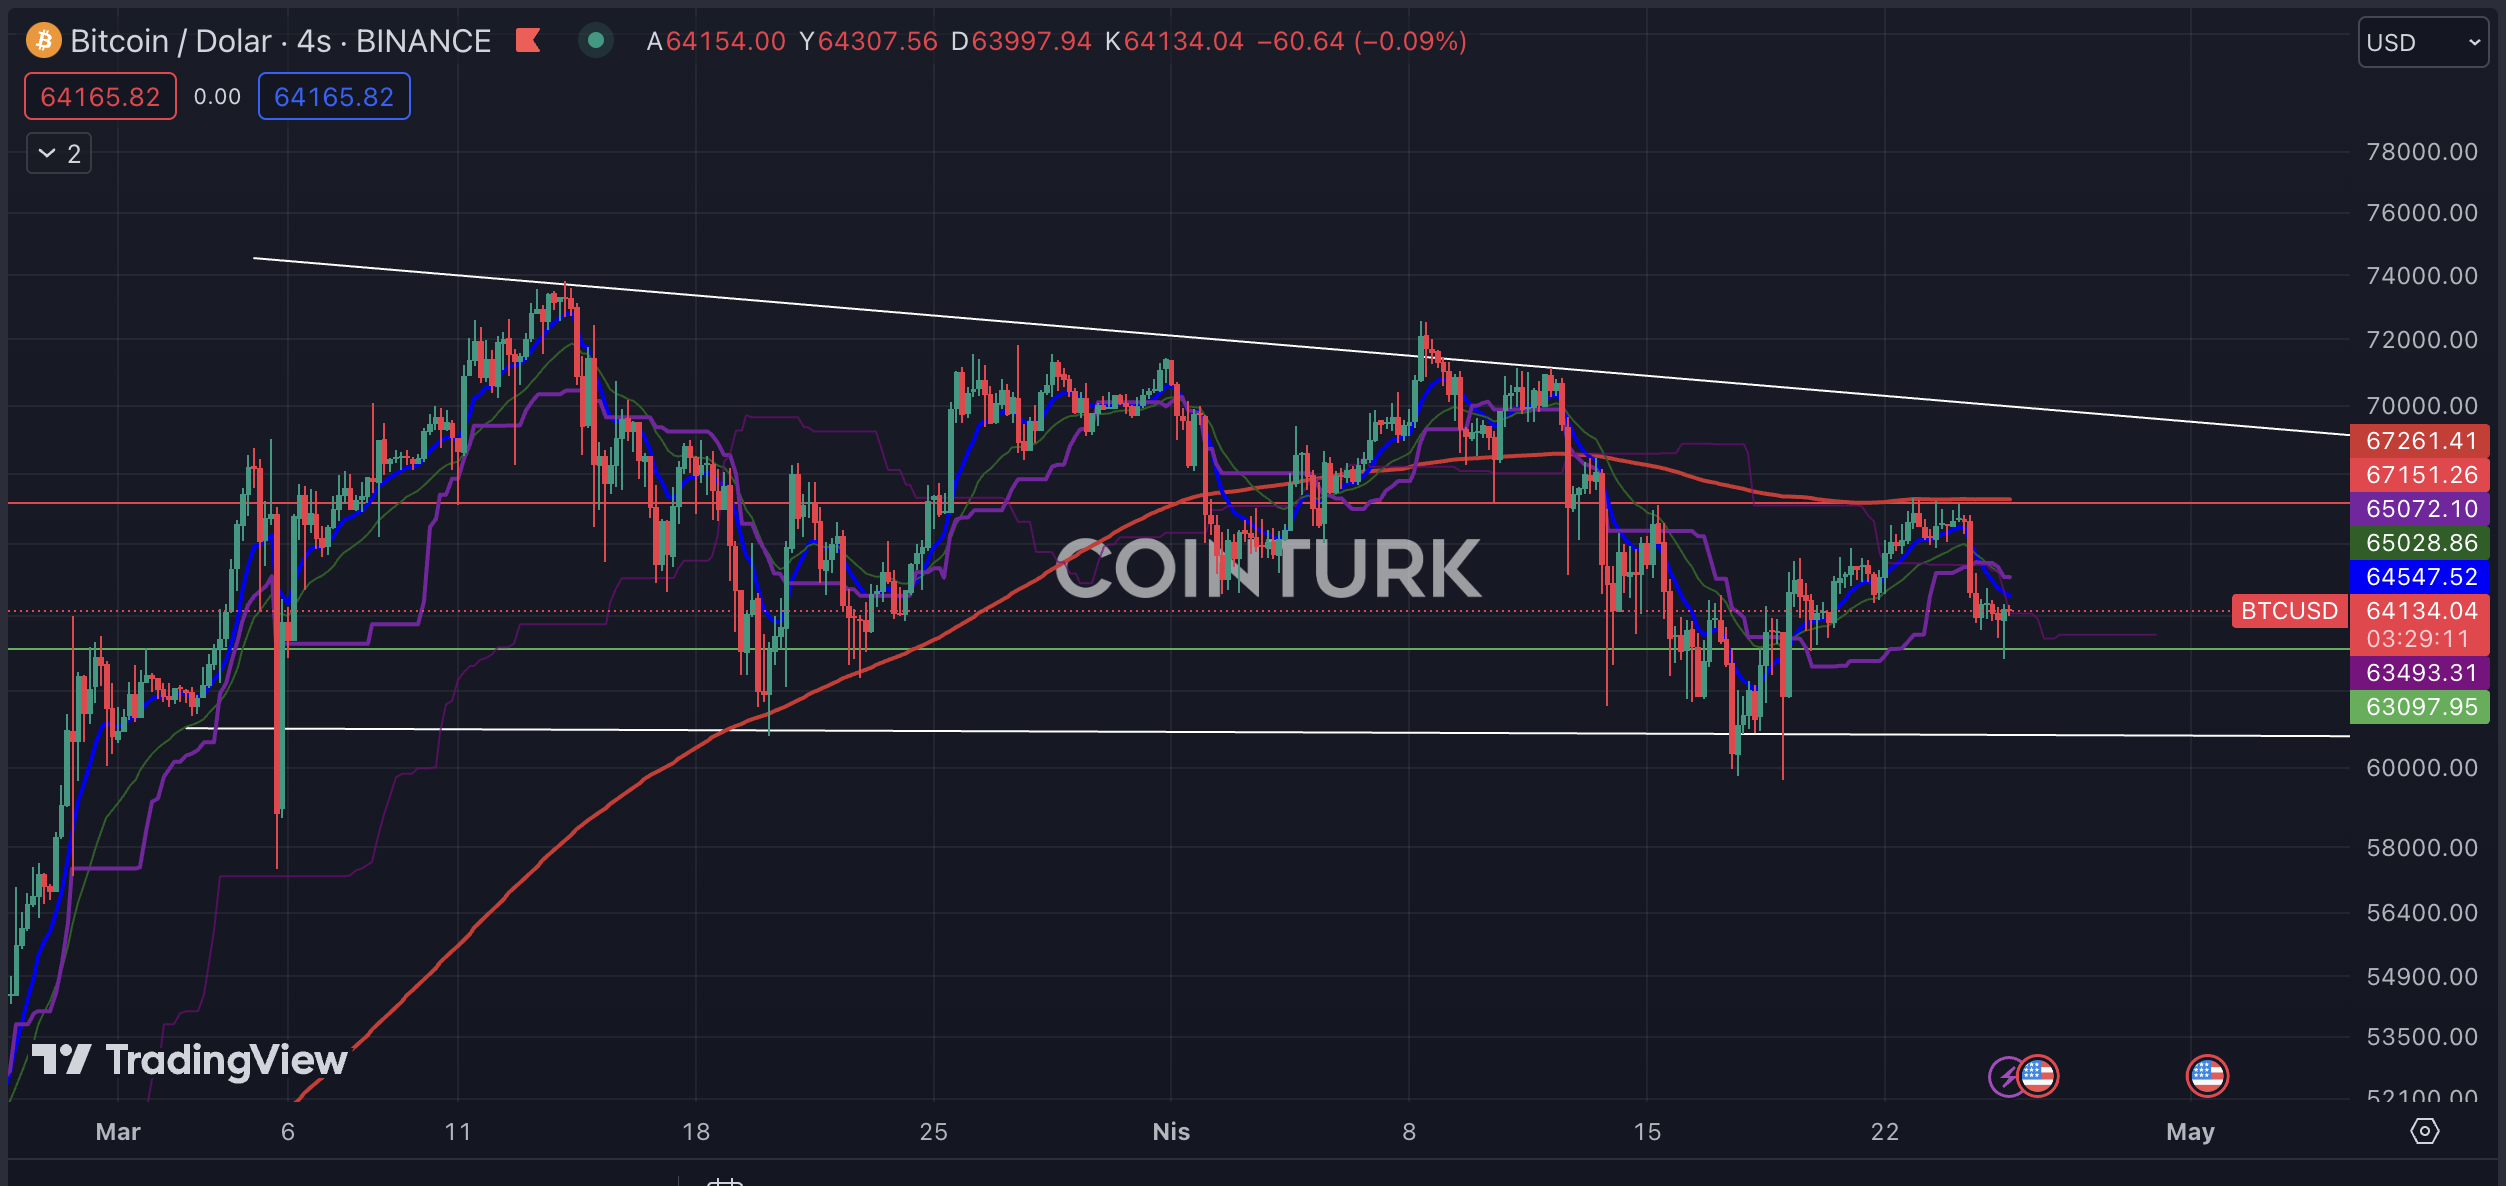
The four-hour Bitcoin chart continues to show a narrowing wedge pattern. After touching the last support, Bitcoin encountered selling pressure at the EMA 200 (red line) and continues to trade below the EMA 9 (blue line).
A crucial support level to watch on the Bitcoin chart is $63,097. A close below this level in a four-hour bar could increase selling pressure for Bitcoin. The key resistance level to monitor is the EMA 200 average at $67,261. A close above this level in a four-hour bar could accelerate Bitcoin’s price momentum.

Ethereum Chart Analysis
The daily Ethereum chart shows a narrowing triangle formation. The upcoming process will shape the price range, which will be determined by a breakout of support or resistance. The last bar staying below the EMA 9 average could lead to short-term selling pressure on Ethereum.

Ethereum has a critical support level at $3082. A daily bar closing below this level could lead to selling pressure on Ethereum. The key resistance level to watch is $3166. A close above this level on a daily bar could boost Ethereum’s price momentum.
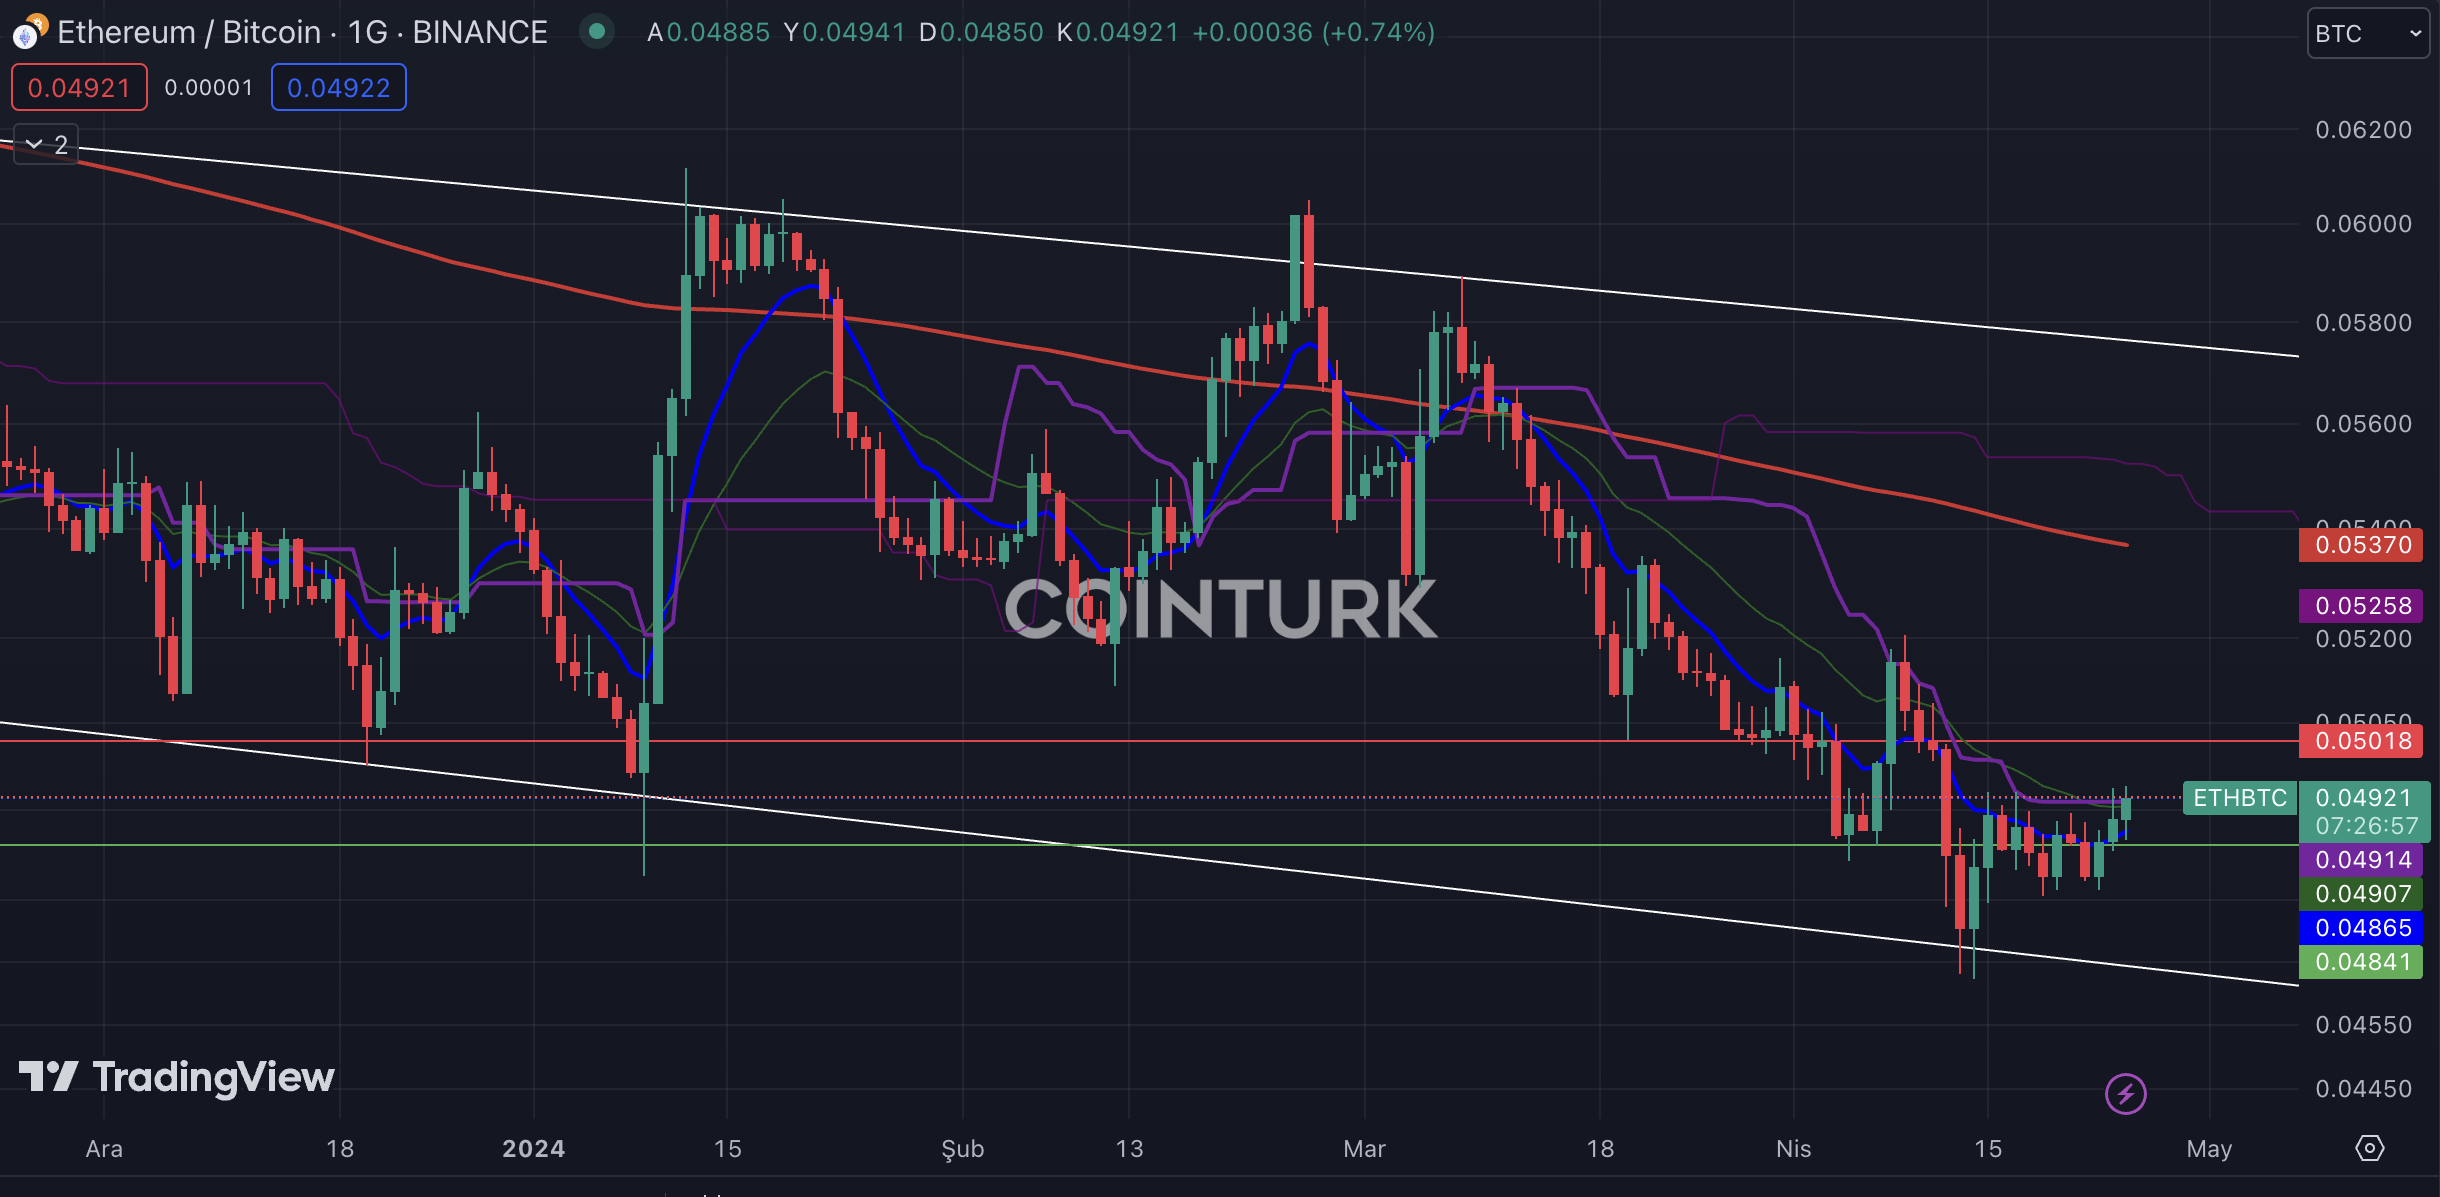
The ETH/BTC chart shows a falling channel formation. After touching the last support, ETH/BTC gained momentum by crossing the EMA 9 average, potentially leading to a significant short-term rise. This could result in Ethereum and other altcoins outperforming Bitcoin.

ETH/BTC has an important support level at 0.04841 BTC. A daily bar closing below this level could lead to Ethereum losing value against Bitcoin. The resistance level to watch for ETH/BTC is 0.05018 BTC. Additionally, the second part of our technical analysis series is now live:

 Türkçe
 Español


