Ripple (XRP) price analysis shows that the altcoin maintains positive market sentiment despite facing resistance near the $0.64 level. Initially, XRP experienced a minor rejection at this resistance zone, leading to a pullback towards the 200-day moving average around $0.54. However, this pullback confirmed a bullish breakout and set the stage for further upward movement.
Daily Time Frame Price Chart Analysis for XRP
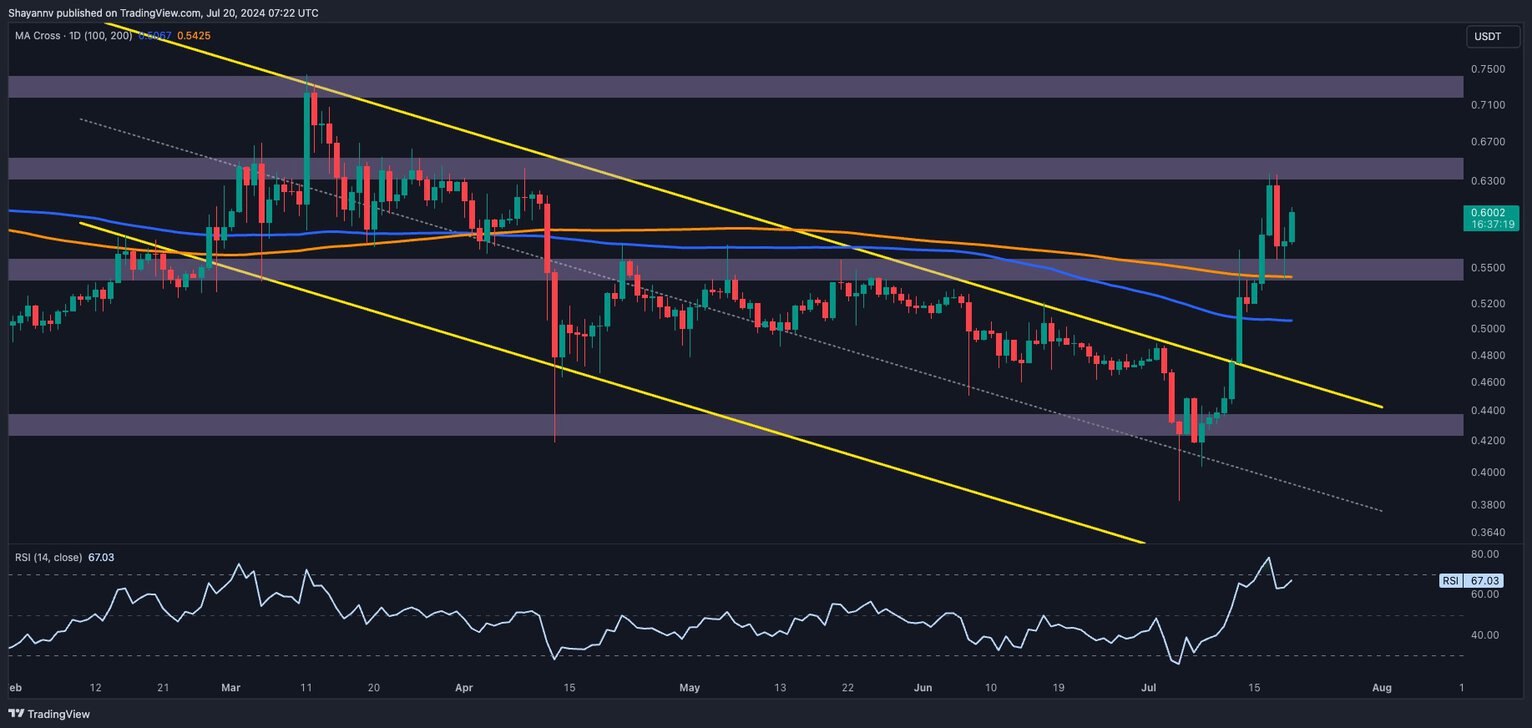
The daily time frame price chart shows Ripple’s XRP consistently moving upwards towards the critical $0.64 resistance zone. This area has proven to be a significant threshold and a key point of interest for investors. Despite encountering resistance and experiencing a pullback, the price action around this level indicates strong buying pressure, showing that the bullish trend remains robust.
 Crypto Traders Are Rushing to This App – Here’s Why You Should Too
The price’s pullback to the 200-day moving average was met with increased buying activity, initiating a new wave of upward movement. This action demonstrates the market’s confidence in XRP’s potential to surpass the $0.64 resistance. Buyers are now focused on pushing the price above this level, but the high Relative Strength Index (RSI) indicator suggests a consolidation period between $0.53 and $0.64 before another significant move.
4-Hour Time Frame Price Chart Analysis for XRP
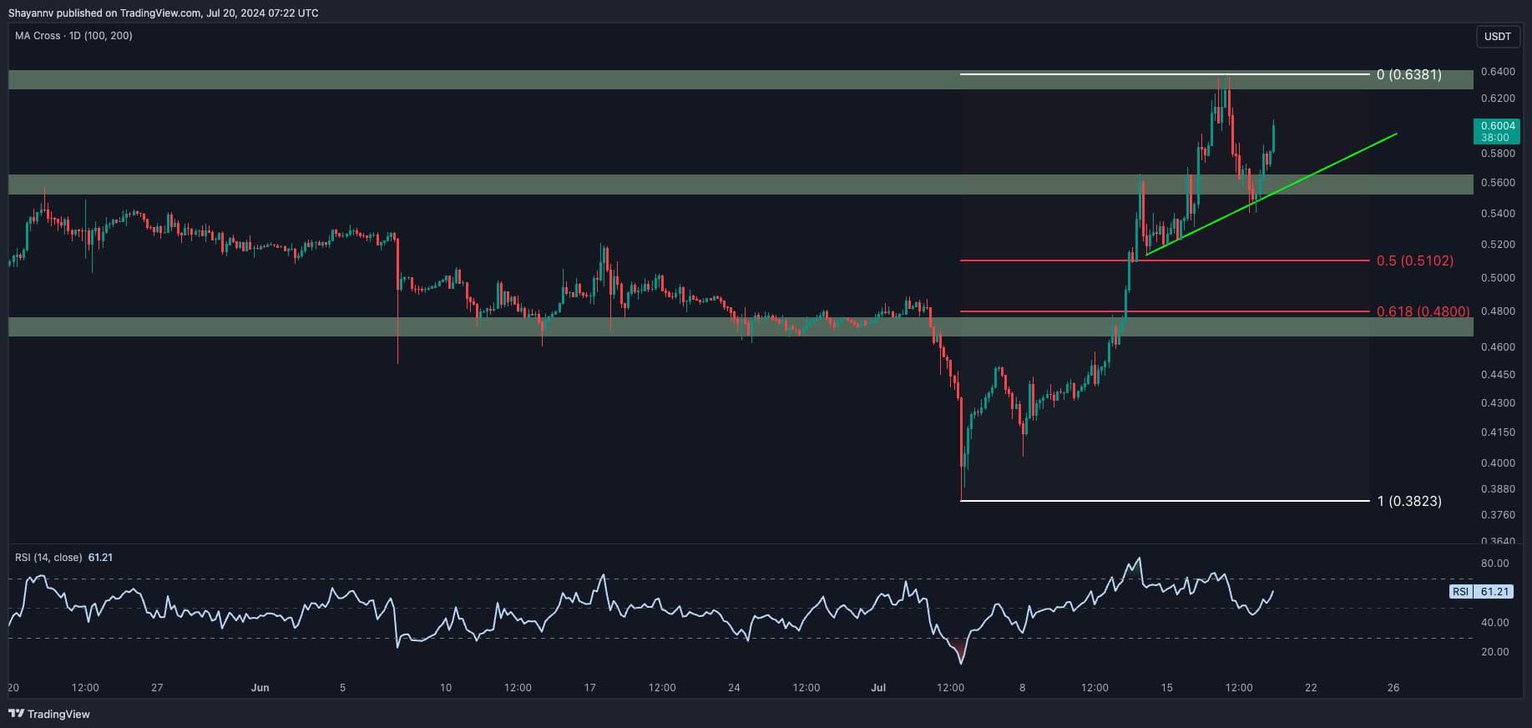
The 4-hour time frame price chart provides more insight into XRP’s recent price movements. When XRP reached the $0.64 level, the bullish rally continued, but this threshold likely triggered significant selling pressure due to profit-taking by investors with long positions. This selling activity led to a pullback towards the $0.54 support zone, where strong buying pressure re-emerged.

During these fluctuations, an ascending trend line indicating a structured upward movement formed. Currently, XRP’s price is confined by the dynamic support of this trend line and the significant $0.64 resistance level. This scenario suggests that the price could consolidate within this range until a decisive breakout occurs.
The current market outlook for XRP indicates that if the price successfully breaks above the $0.64 resistance, a new bullish trend towards the $0.70 region is likely. Investors should closely monitor the price movements, especially around the $0.64 level, as a breakout here could signal the next phase of the altcoin’s upward movement.
Considering the high RSI and recent price movements, a temporary horizontal consolidation phase may begin. This consolidation phase is necessary for the market to gain momentum for a potential breakout. During this period, the $0.53 to $0.64 range will be critical, providing a buffer for the price to stabilize before making a significant move.


 Türkçe
 Español


