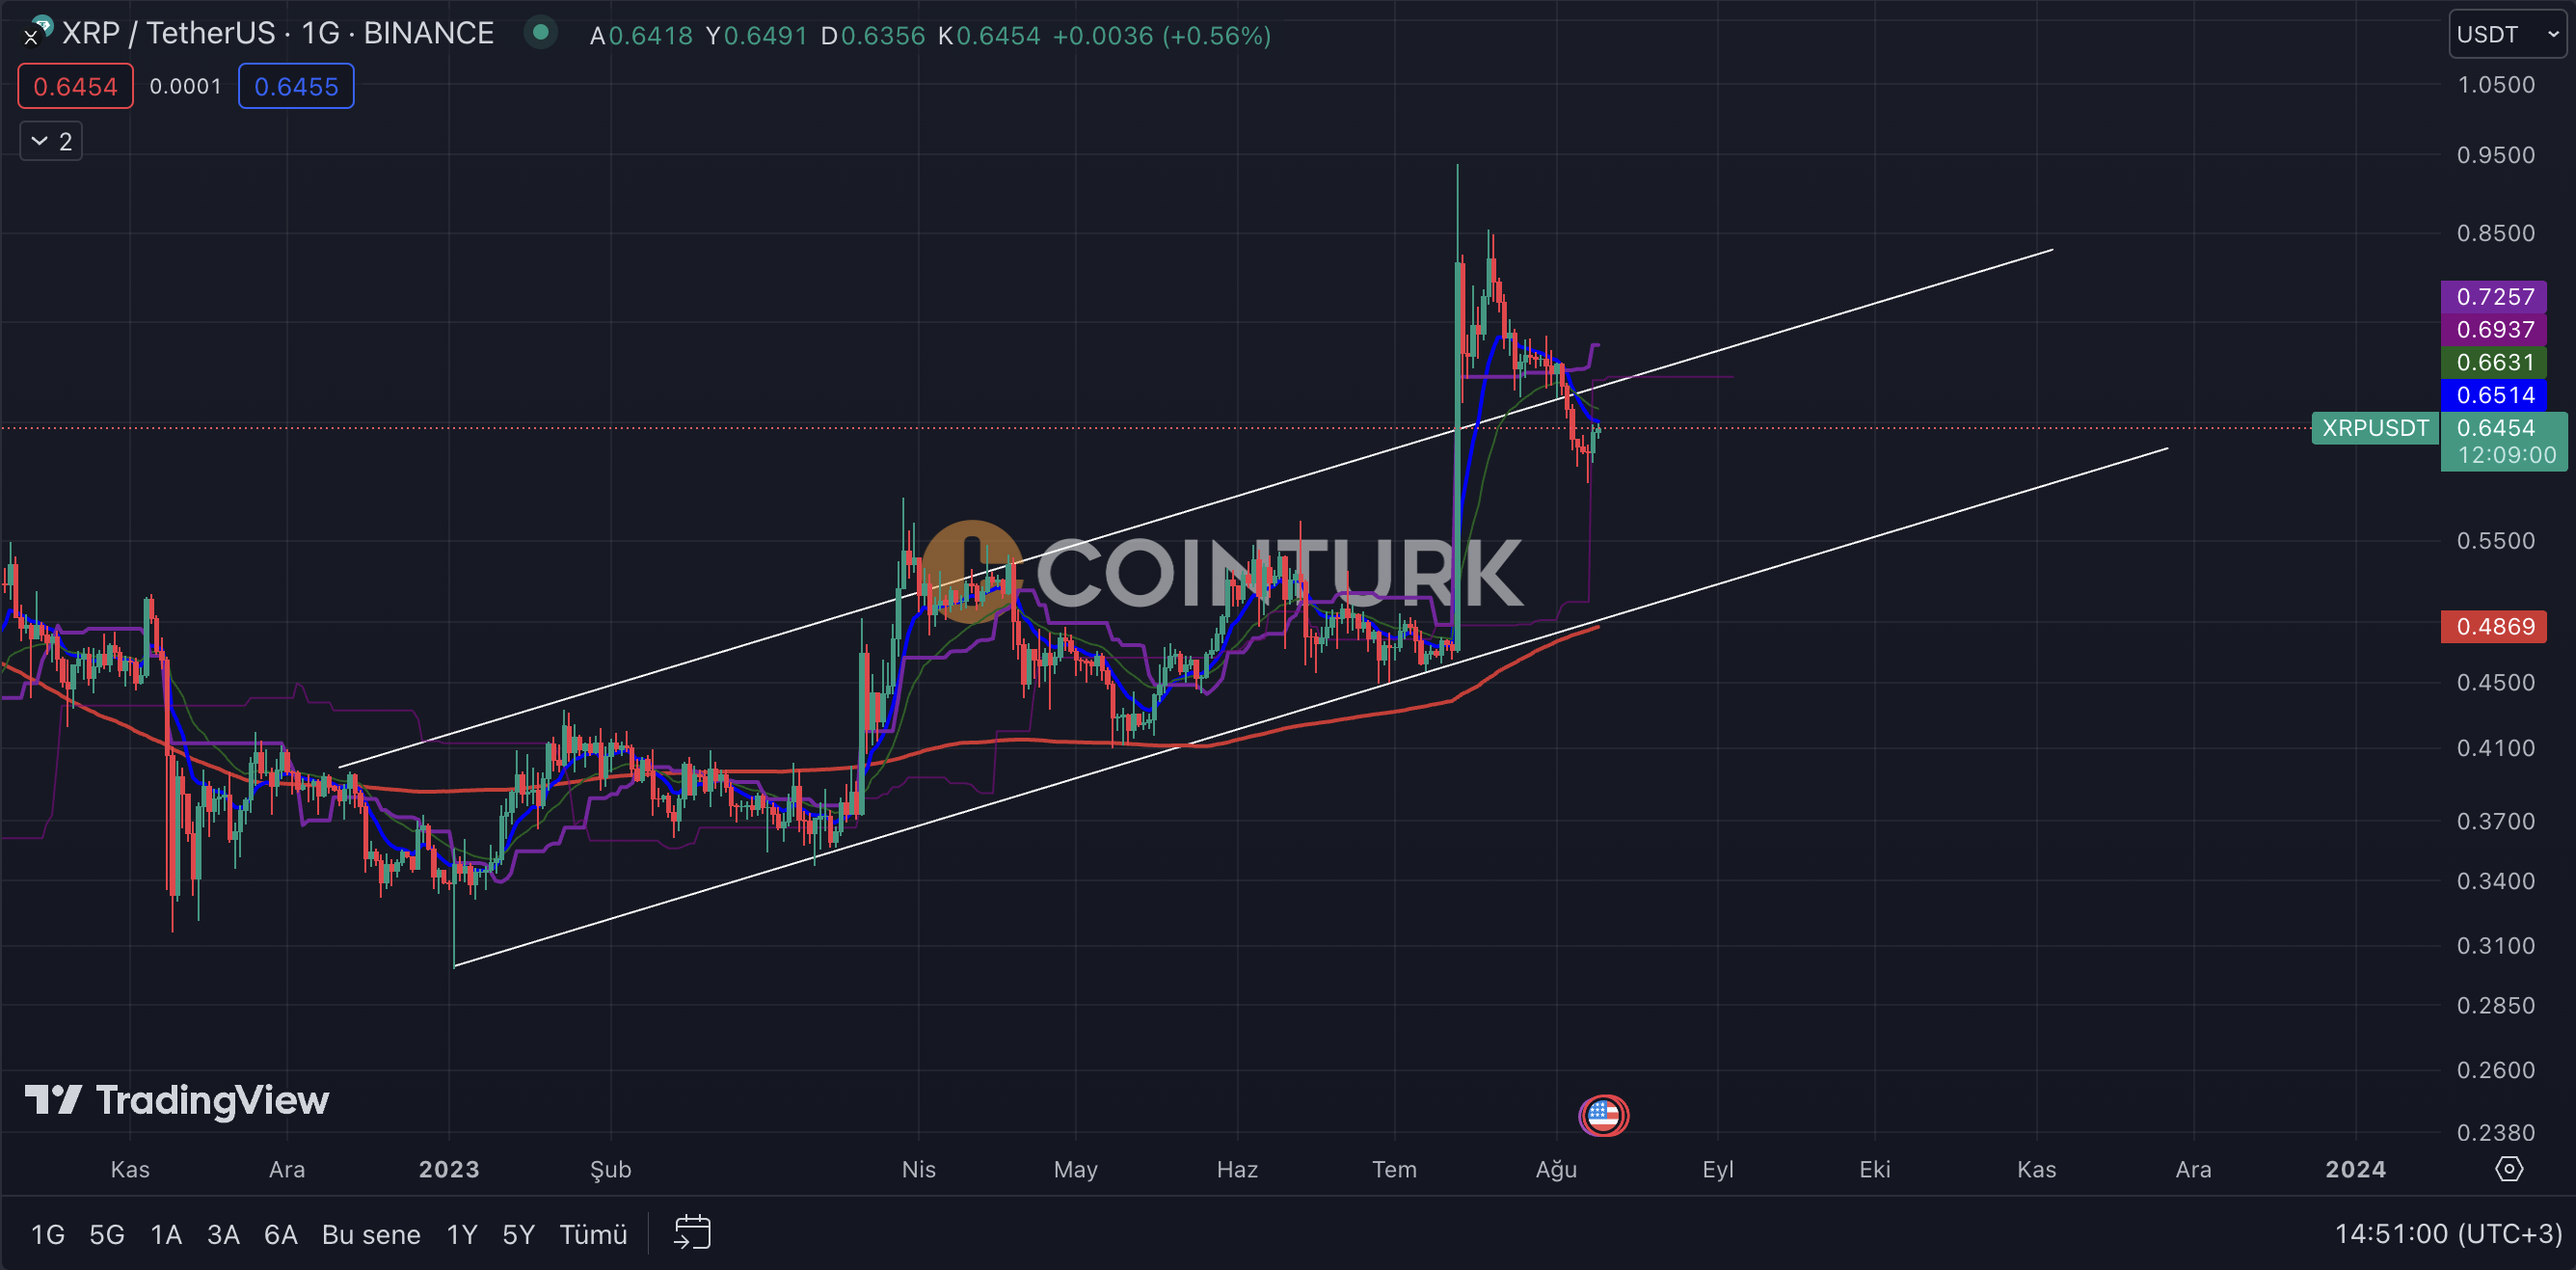
Following the groundbreaking precedent set by the SEC case on July 13, Ripple‘s price, which almost doubled on the same day, has been experiencing a decline for almost three weeks. Despite the positive news flow, the technical analysis results for Ripple are not promising. The appeal made by the SEC after the court decision and this appeal process caused the price of XRP to fall, and as a result, Ripple’s price decreased by almost 30%.
Ripple Chart Analysis
The ascending channel formation that has been in place since February 2023 on the daily chart served as strong support after the incredible surge on July 13. However, with the decrease in volume in the past week, the price broke down and continues to move below the line that acted as support. Considering all these factors, the first target within the channel appears to be the daily EMA 200 average, which is seen as the $0.48 level. Currently trading at $0.64, with support at the $0.60 level, the price faces resistance from the EMA 21 and EMA 9 averages. Taking all this into account, a further decline in price seems more likely. The resistance levels that investors should pay attention to are $0.60, $0.55, $0.48, and $0.41, respectively. Especially the $0.48 level is the most important support level to be cautious about, as it is both the support zone of the channel and the daily EMA 200 average.

News-Driven Surge
In the event of a negative court decision in response to the appeal by the SEC, the price of XRP could be priced beyond expectations. Such a development for XRP, which has been relisted on major cryptocurrency exchanges since the decision, could initiate a new trend. In such a case, the resistance levels to watch out for are $0.67, $0.72, $0.85, and $1, respectively. Especially the $0.85 level stands out as the most significant obstacle in the XRP chart, as it has acted as resistance three times in the recent uptrend.

 Türkçe
 Español


