The daily rise in the cryptocurrency market led by Bitcoin has caused the prices of many altcoins to rise. Despite the recent volatility and weak volume eroding returns for at least two years in the market, many altcoins continue to offer buying opportunities. In this article, we will examine the daily and hourly charts of Shiba Inu.
Shiba Inu Chart Analysis
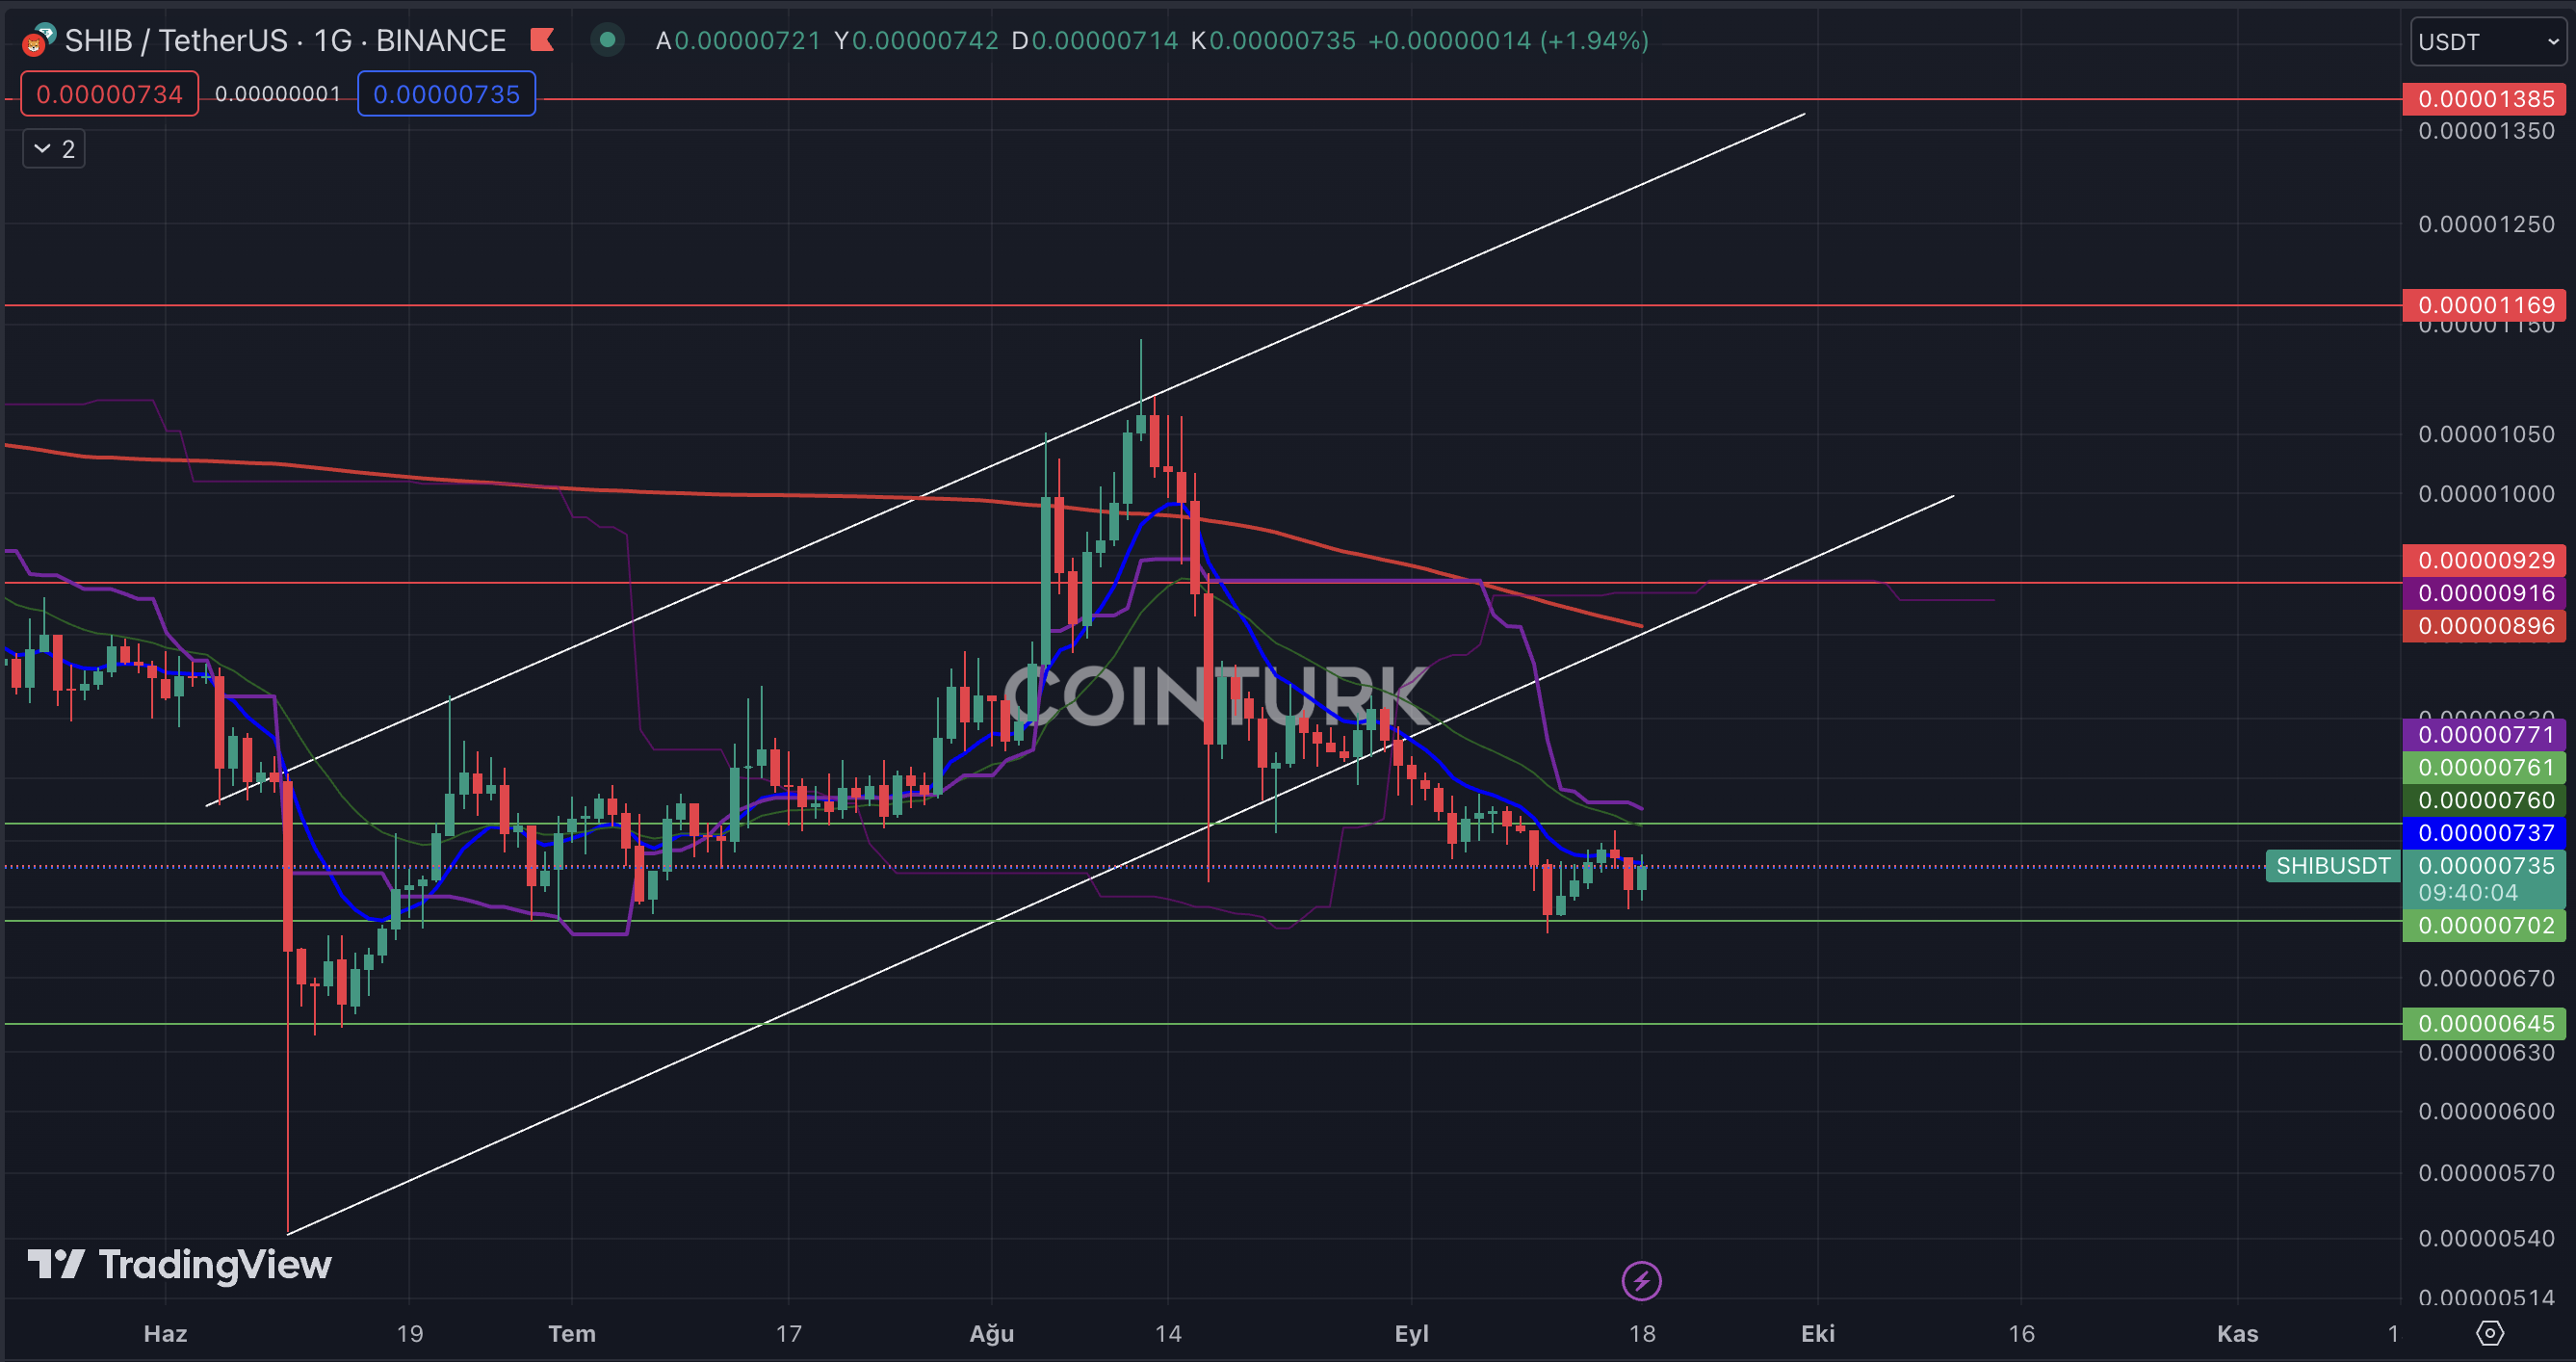
The most important formation that stands out in the daily chart of Shiba Inu is the ascending channel formation that recently broke its support. While the break of this formation has a negative impact on the price, the consolidation of SHIB price in a narrow range appears to be a formation we have seen in the cryptocurrency market, including Bitcoin.
The most important support levels to be followed for SHIB in the long term are respectively; 0.00000702 / 0.00000645 and 0.000000540 dollar levels. Although these levels do not correspond to any EMA average, they appear as previously worked support levels, although they do not provide much confidence. The resistance levels to be followed are respectively; 0.00000761, 0.00000896, and 0.00001050 dollar levels.

SHIB Short-Term Chart Analysis
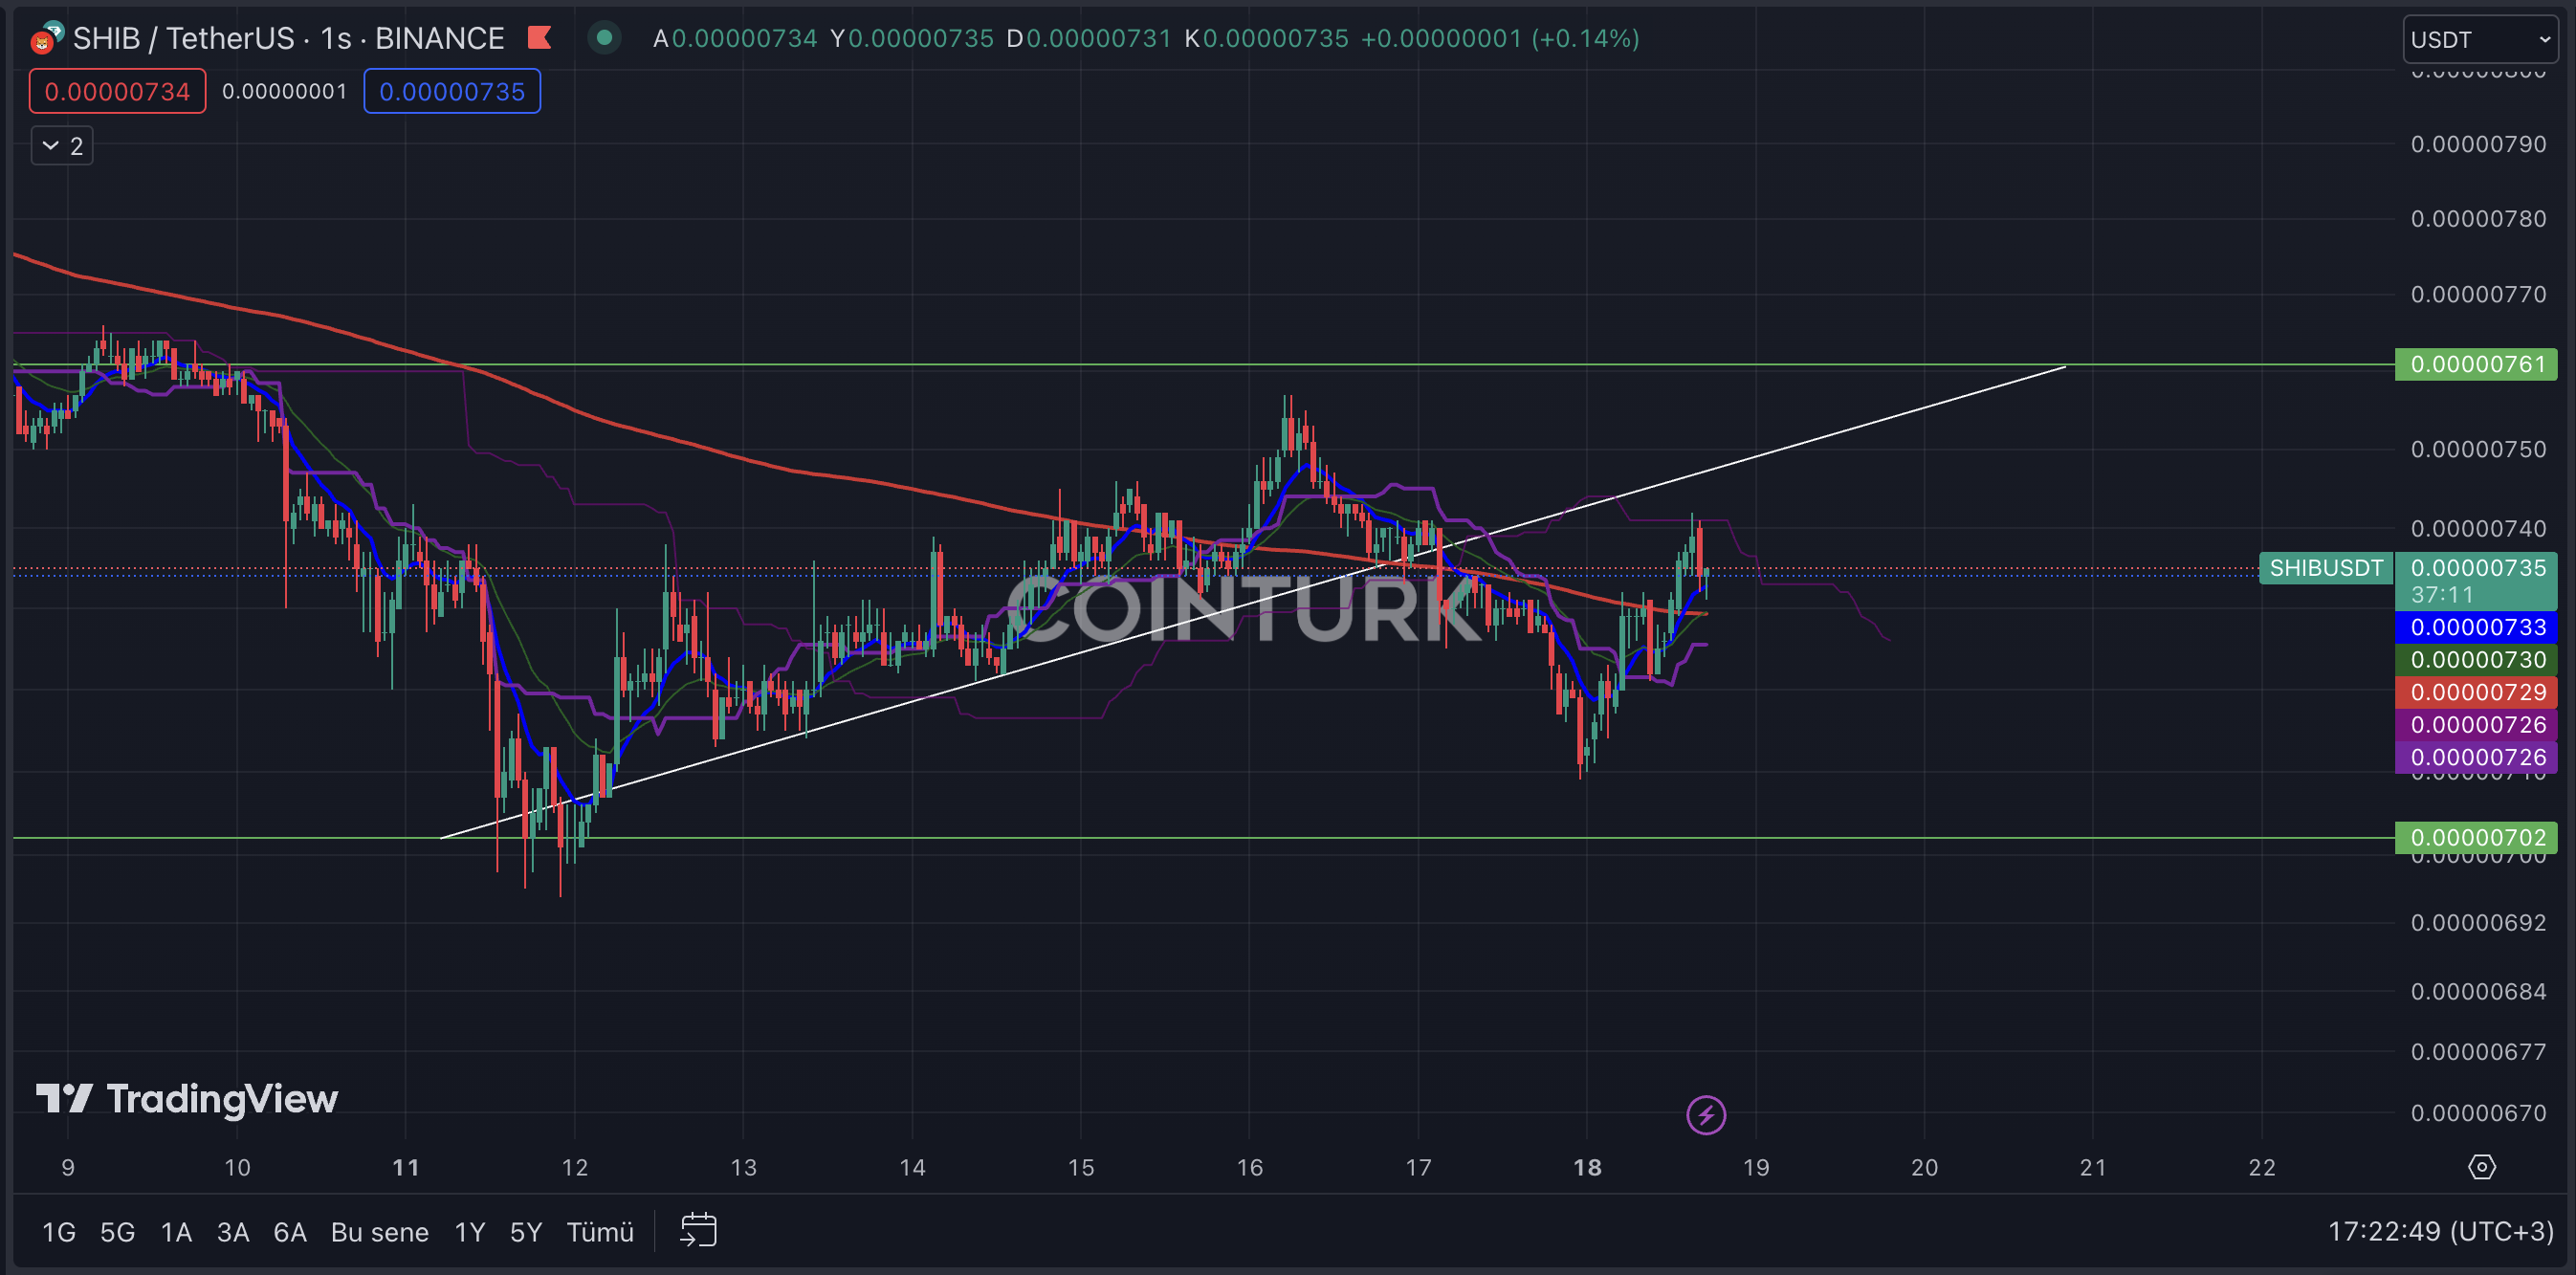
The consolidation of SHIB price in a narrow range has been a situation that has been going on for almost the past week and seems to have led to significant gains in the short term. After an almost 5-day price increase, the break of the support line caused a significant loss, and the SHIB price recently broke the 1-hour EMA 200 average and used this average as support after the correction.
The support levels to be watched for SHIB in the short term are respectively; 0.00000729 / 0.00000726 and 0.00000702 levels. Especially the 0.00000702 level is of vital importance as it has served as support many times before. The resistance levels to be followed for SHIB are respectively; 0.00000750 / 0.00000770 and 0.00000790 dollar levels. Especially if a 1-hour closing is made above the 0.00000770 level, there can be talk of an increase in the SHIB price.


 Türkçe
 Español


