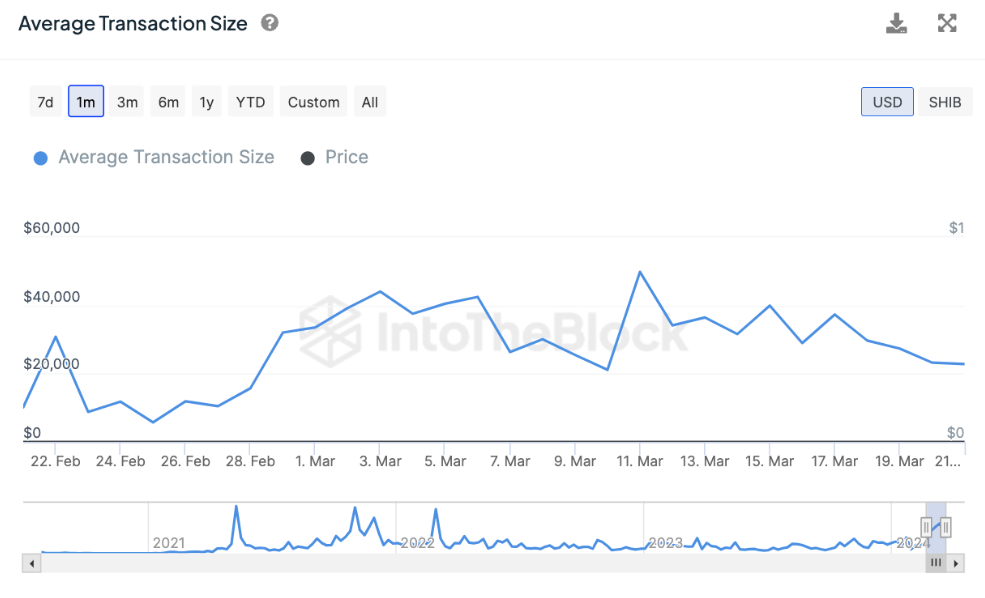
A sharp decline in the price of meme coin Shiba Inu (SHIB) is observed. Accordingly, the average transaction size has also decreased by 50% in the last two weeks. This situation may indicate a possible change in investor sentiment toward Shiba Inu. The decrease in transaction volume could suggest that the recent increase in purchases has slowed down and perhaps signals that the market may be subject to a broader reassessment.
Average Transaction Size Decreases
Looking at the average transaction size of SHIB (Shiba Inu) last month presents an interesting picture. Between February 21 and March 6, this size increased from $10,139 to $42,491. This represents an increase of 319.08% over approximately two weeks.
During the same period, SHIB’s price rose from $0.000009 to $0.000034, registering an increase of 277.78%. We see that these metrics were correlated during the last bull run.

Subsequently, the average transaction size increased further and then dropped significantly. On March 11, it fell from $49,816 to $22,824 by March 21, a decrease of 54.18%. During the same period, the SHIB price dropped from $0.000033 to $0.000027, showing a decrease of 18.18%.
Considering that these two metrics have been closely related over the last few months, the gap between this significant drop in average transaction size and the price correction could be closed with a potential further decrease in SHIB prices in the coming days.
SHIB RSI Still in Overbought Phase
Despite having experienced a correction in its price recently, SHIB’s Relative Strength Index (RSI) is still at a high level of 81. This indicates potential downward momentum. A high RSI level, significantly exceeding the 70 mark, suggests that SHIB could currently be overvalued. This could set the stage for a potential decline in SHIB’s price.
Generally, an RSI value exceeding 70 indicates that an asset has been subjected to overbuying activity and increases the likelihood of an impending pullback as the market tries to restore the balance of supply and demand.
The RSI metric acts as a momentum oscillator that measures the velocity and change of price movements and is used in technical analysis as a significant tool based on price movements within a range of 0 to 100. SHIB’s RSI value decreased from 88 on March 11 to 81 on March 21, indicating a slight decrease in buying momentum but still remaining in the overbought zone. This is typically interpreted by investors as a bearish signal and indicates that the asset may be under significant buying pressure that may not be sustainable.
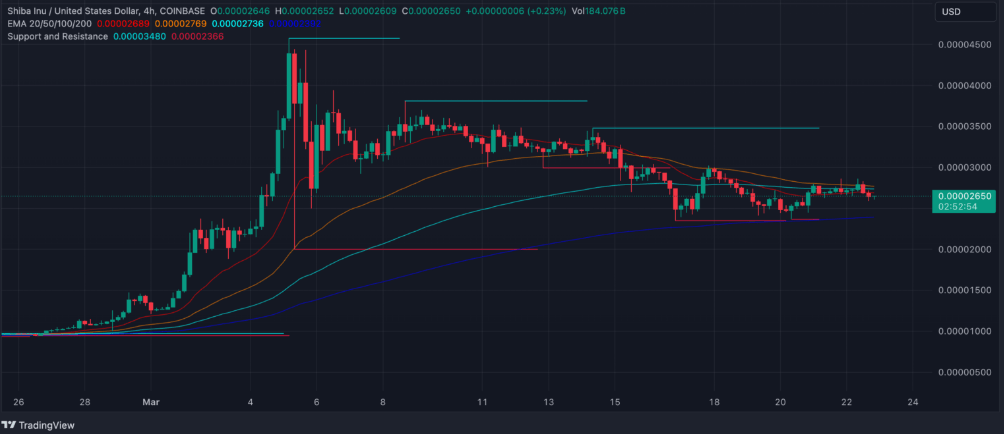
Will SHIB Maintain Support at $0.000023?
Currently, the Exponential Moving Average (EMA) lines for SHIB point to an interesting situation in price movements. The short-term EMA lines are approaching below the long-term EMA lines. This potential crossover indicates a scenario of possible downward momentum and implies that the price could drop if the trend continues.

Furthermore, the proximity of the EMA lines to each other and the current price line suggests that the market is in an uncertain state. When EMA lines are closely related to the current price, it often indicates a consolidation period where the price could break in either direction depending on market sensitivity and upcoming developments.


