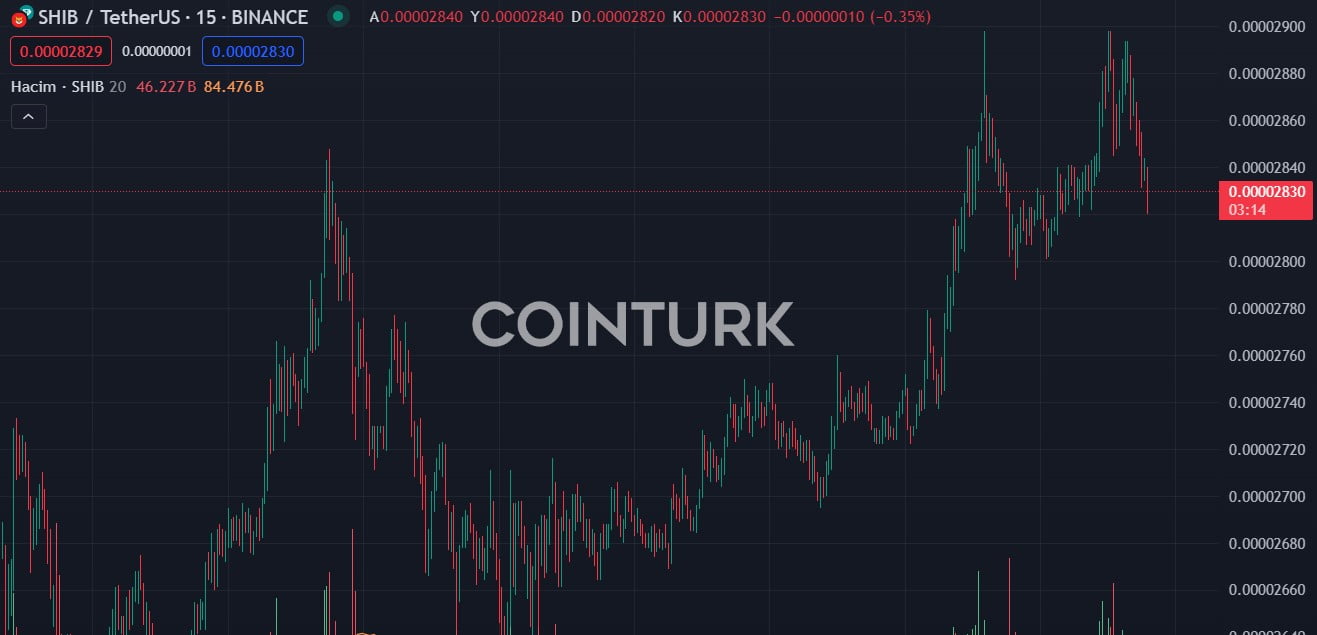
The popular meme token Shiba Inu (SHIB) could extend its month-long decline as volatility indicators analyzed on the weekly chart suggest significant market fluctuations. According to data from 21milyon.com, at the time of writing, SHIB was trading at $0.00003, having fallen by 30% over the past month.
Critical Indicator for SHIB
Data from volatility indicators on the weekly chart show that as long as market volatility persists, SHIB is likely to continue trending downwards. For example, the gap between the upper and lower bands of the Bollinger Bands indicator has widened. This indicator measures market volatility and identifies potential price trends. A widening gap between the bands can indicate increased volatility in the price of the altcoin in question.
Furthermore, if the gap widens while the token’s price is moving in a certain direction, it can signal a strengthening trend. In the case of SHIB, a continuous price decline combined with the widening gap in the Bollinger Bands could indicate a strong downward trend. The average true range, which confirms the volatile nature of the SHIB market, was trending upwards at the time of writing.

SHIB Price Forecast
This measure calculates the average range between high and low prices over a certain number of periods to gauge market volatility. When the metric rises, it indicates that price volatility is becoming more pronounced. Similarly, SHIB’s Chaikin volatility indicator has been relatively flat since the end of March. This indicator measures the difference between the highest and lowest prices of a token over a certain period.
Generally, when the Chaikin Volatility indicator rises to return higher values, it can signal significant potential price fluctuations. Despite the increased risk of further decline, accumulation continues among market participants. The fundamental momentum indicators observed on the weekly chart for the cryptocurrency confirm this. At the time of writing, the relative strength index (RSI) was 61.54 and the money flow index (MFI) was 75.57. These indicators could suggest that buying activity is continuing despite the possibility of a further drop in SHIB’s value.

 Türkçe
 Español


