In the recent months, while many altcoin investors were pleased with the process in the cryptocurrency market, the most valuable memecoin projects did not show the expected performance during this rise. The memecoin hype in the Solana ecosystem, in particular, caused investors to prefer new projects. So, what is happening with Shiba Inu, the second most valuable memecoin project? Let’s take a look.
Shiba Inu Daily Chart Analysis
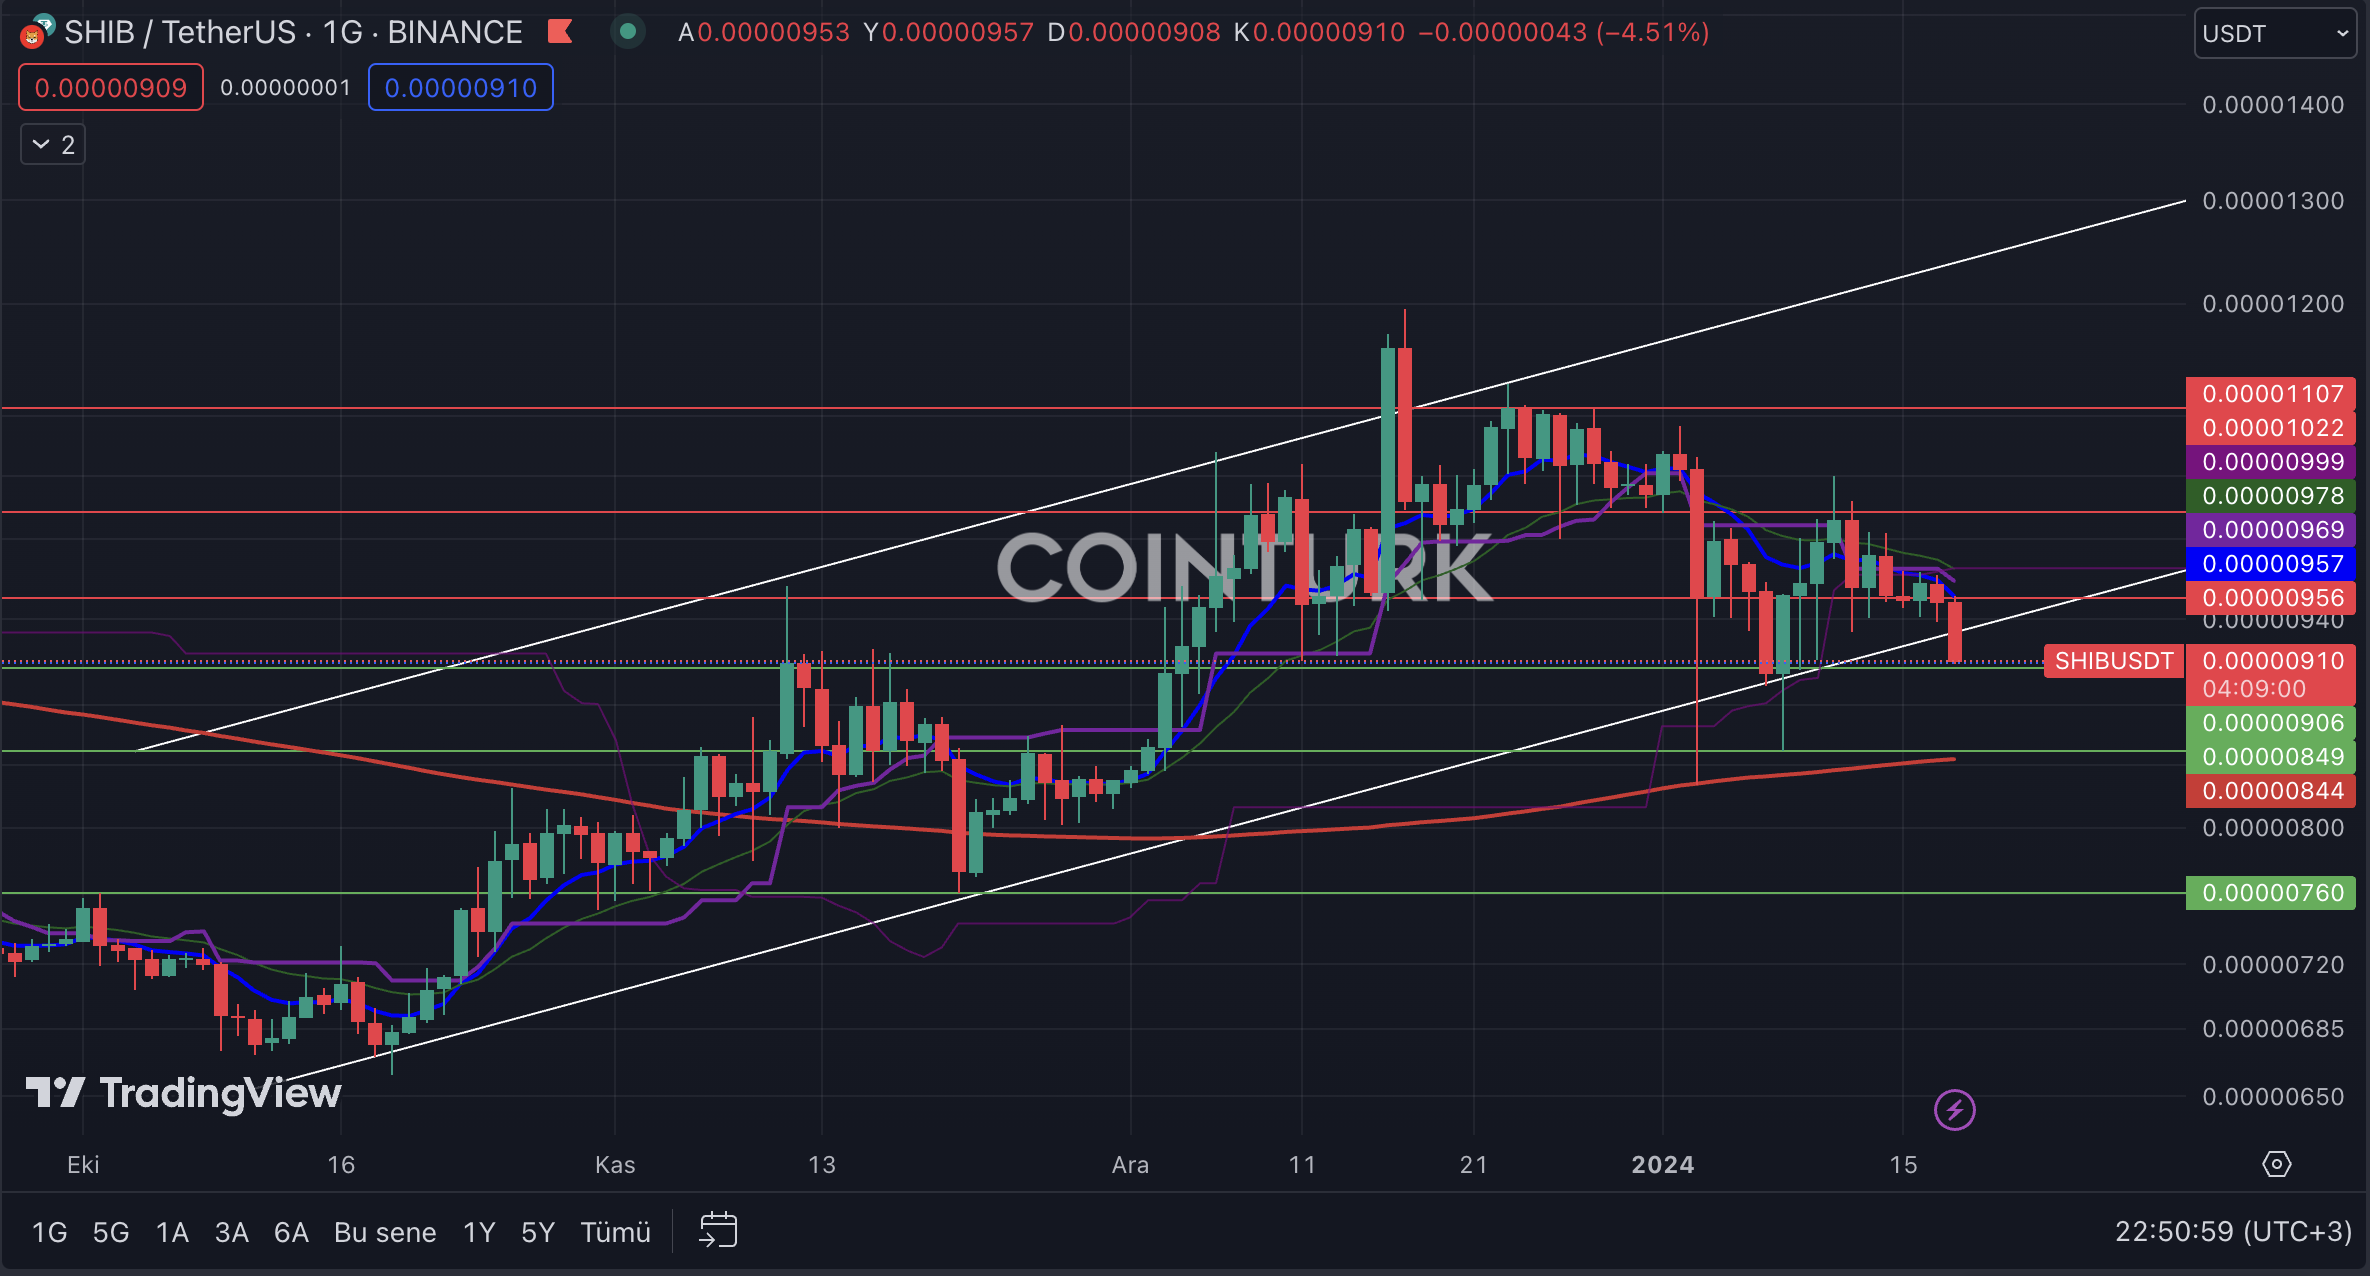
The first notable formation structure in the daily SHIB chart is the ascending channel formation. In this formation structure, the EMA 200 level (red line) played an important role as support during the support breaks in 2024, and daily bar formations occurred above the support line. However, the break that occurred today could cause fear and concern for investors.
The most important support levels to follow on the SHIB chart are; 0.00000906 / 0.00000849 and 0.00000760 dollars, respectively. Especially if a daily bar closes below the 0.00000849 dollar level, which intersects with the EMA 200 level, it will increase the selling pressure on the SHIB front and disrupt the formation structure. Crypto Traders Are Rushing to This App – Here’s Why You Should Too
The most important resistance levels to watch on the daily SHIB chart are; 0.00000956 / 0.00001022 and 0.00001107 dollars, respectively. Especially if a daily bar closes above the 0.00000956 dollar level, it will allow SHIB to return to its formation structure and make an important leap for the rise.

Shiba Inu Hourly Chart Analysis
The hourly SHIB chart features a descending channel formation. This formation structure has broken the support in the last bar formation, which could lead to a downward trend. The increase in SHIB selling pressure in recent hours is another noteworthy issue.
The most important support levels to follow on the hourly SHIB chart are; 0.00000901 / 0.00000890 and 0.00000875 dollars, respectively. Especially if an hourly bar closes below the 0.00000901 dollar level, which acted as support in the last bar formation, it could accelerate the selling pressure on the SHIB front.
The most important resistance levels to watch on the hourly SHIB chart are; 0.00000919 / 0.00000933 and 0.00000942 dollars, respectively. Especially if an hourly bar closes above the 0.00000919 dollar level, it could help SHIB regain its formation structure and gain upward momentum.


 Türkçe
 Español


