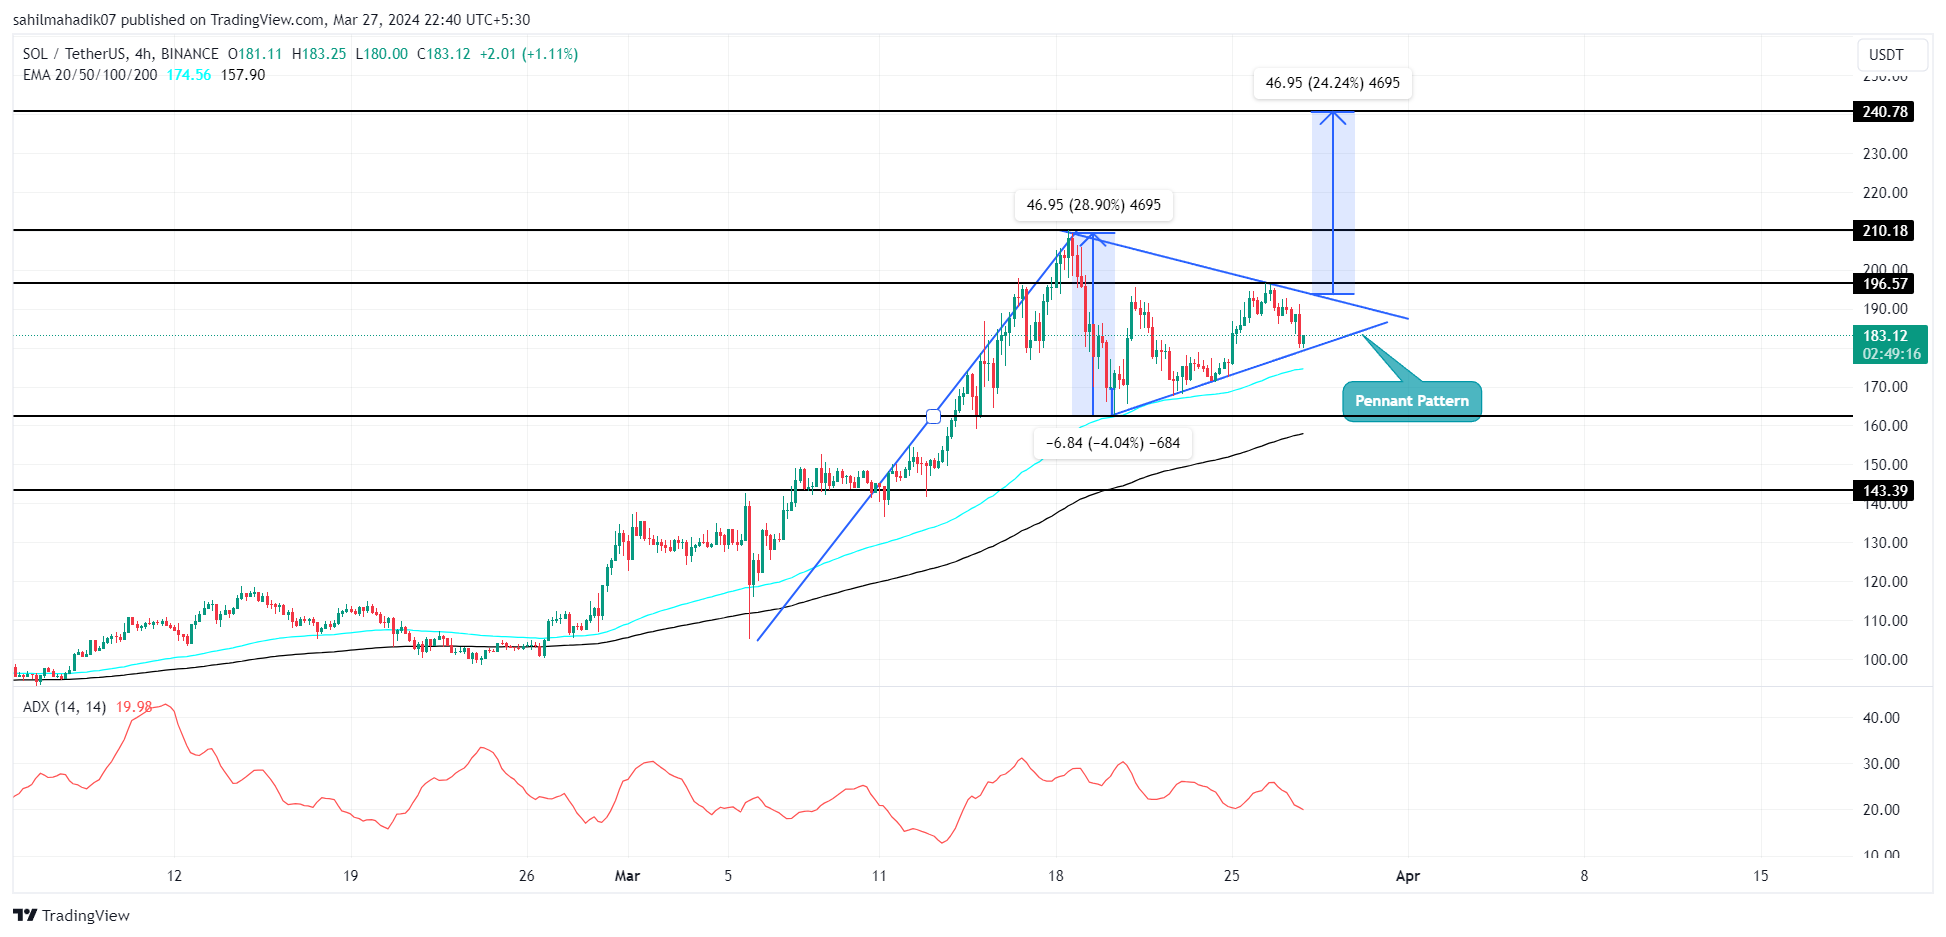
In the second half of March, major cryptocurrencies, including Solana (SOL), experienced significant fluctuations. Bitcoin (BTC) price underwent a sharp correction, rising to $60,000, but then surpassed $70,000 within two weeks, contributing to a sense of unpredictability among market participants.
Flag Formation Indicates a Potential Rise for SOL
Despite this consolidation, SOL price is showing the opportunity to create a directional rise with the formation of a bullish flag pattern. Amid the latest market correction, the Solana rally retraced from the $210 barrier and shifted its price trajectory to a horizontal direction on the 4-hour chart. The consolidation bouncing between two converging trend lines indicates the formation of a technical chart pattern known as a flag.
Currently, SOL price is trading at $181, with a 5% intraday loss moving towards the lower trend line of the formation. With a market value of $80.5 billion, Solana continues to hold its position as the fifth-largest cryptocurrency. According to the latest analytical reports from SolanaFloor, decentralized exchanges (DEX) on the Solana blockchain have reached a remarkable milestone with over $50 billion in transaction volumes, achieving the highest level of monthly activity ever.

SOL Registers a 126% Increase
Solana’s reported increase represents an impressive 126% growth compared to the previous month, indicating a significant rise in liquidity and analyst interest in the Solana ecosystem. Following the broader market recovery, Solana price is in a better position to break the upper boundary of the flag formation.
A successful breakout would signal the continuation of the recovery trend and could encourage buyers to pursue potential targets at $240 and then $285. Conversely, a breakdown from the triangle support could extend the SOL cryptocurrency correction below the $150 level.

 Türkçe
 Español


